Bat Pattern and its trading strategy
Bat Pattern and its trading strategy :
The bat pattern is one of the types of harmonic patterns in technical analysis that provides very good conditions for entering into a profitable transaction. This pattern can appear on the price chart in both ascending and descending bats.
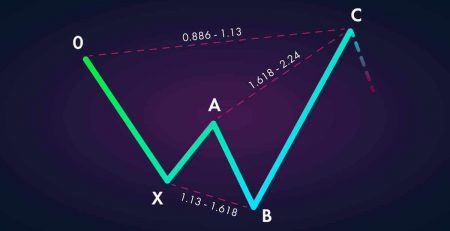
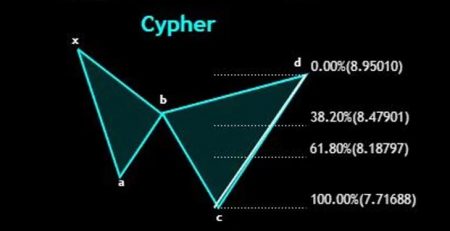
The bat pattern is very similar to the Cypher harmonic pattern. One of the differences between the bat pattern and the cipher pattern is the location of point B. If point B does not exceed the 50% Fibonacci level of the X-A wave, the bat pattern is formed. Otherwise a Cypher harmonic pattern is formed.
Bat trading strategy appears in all time frames and in all markets. But keep in mind that this pattern is less common in low timeframes. Therefore, it is better to do more research when it is formed in low time frames.
How to trade based on Bat pattern?
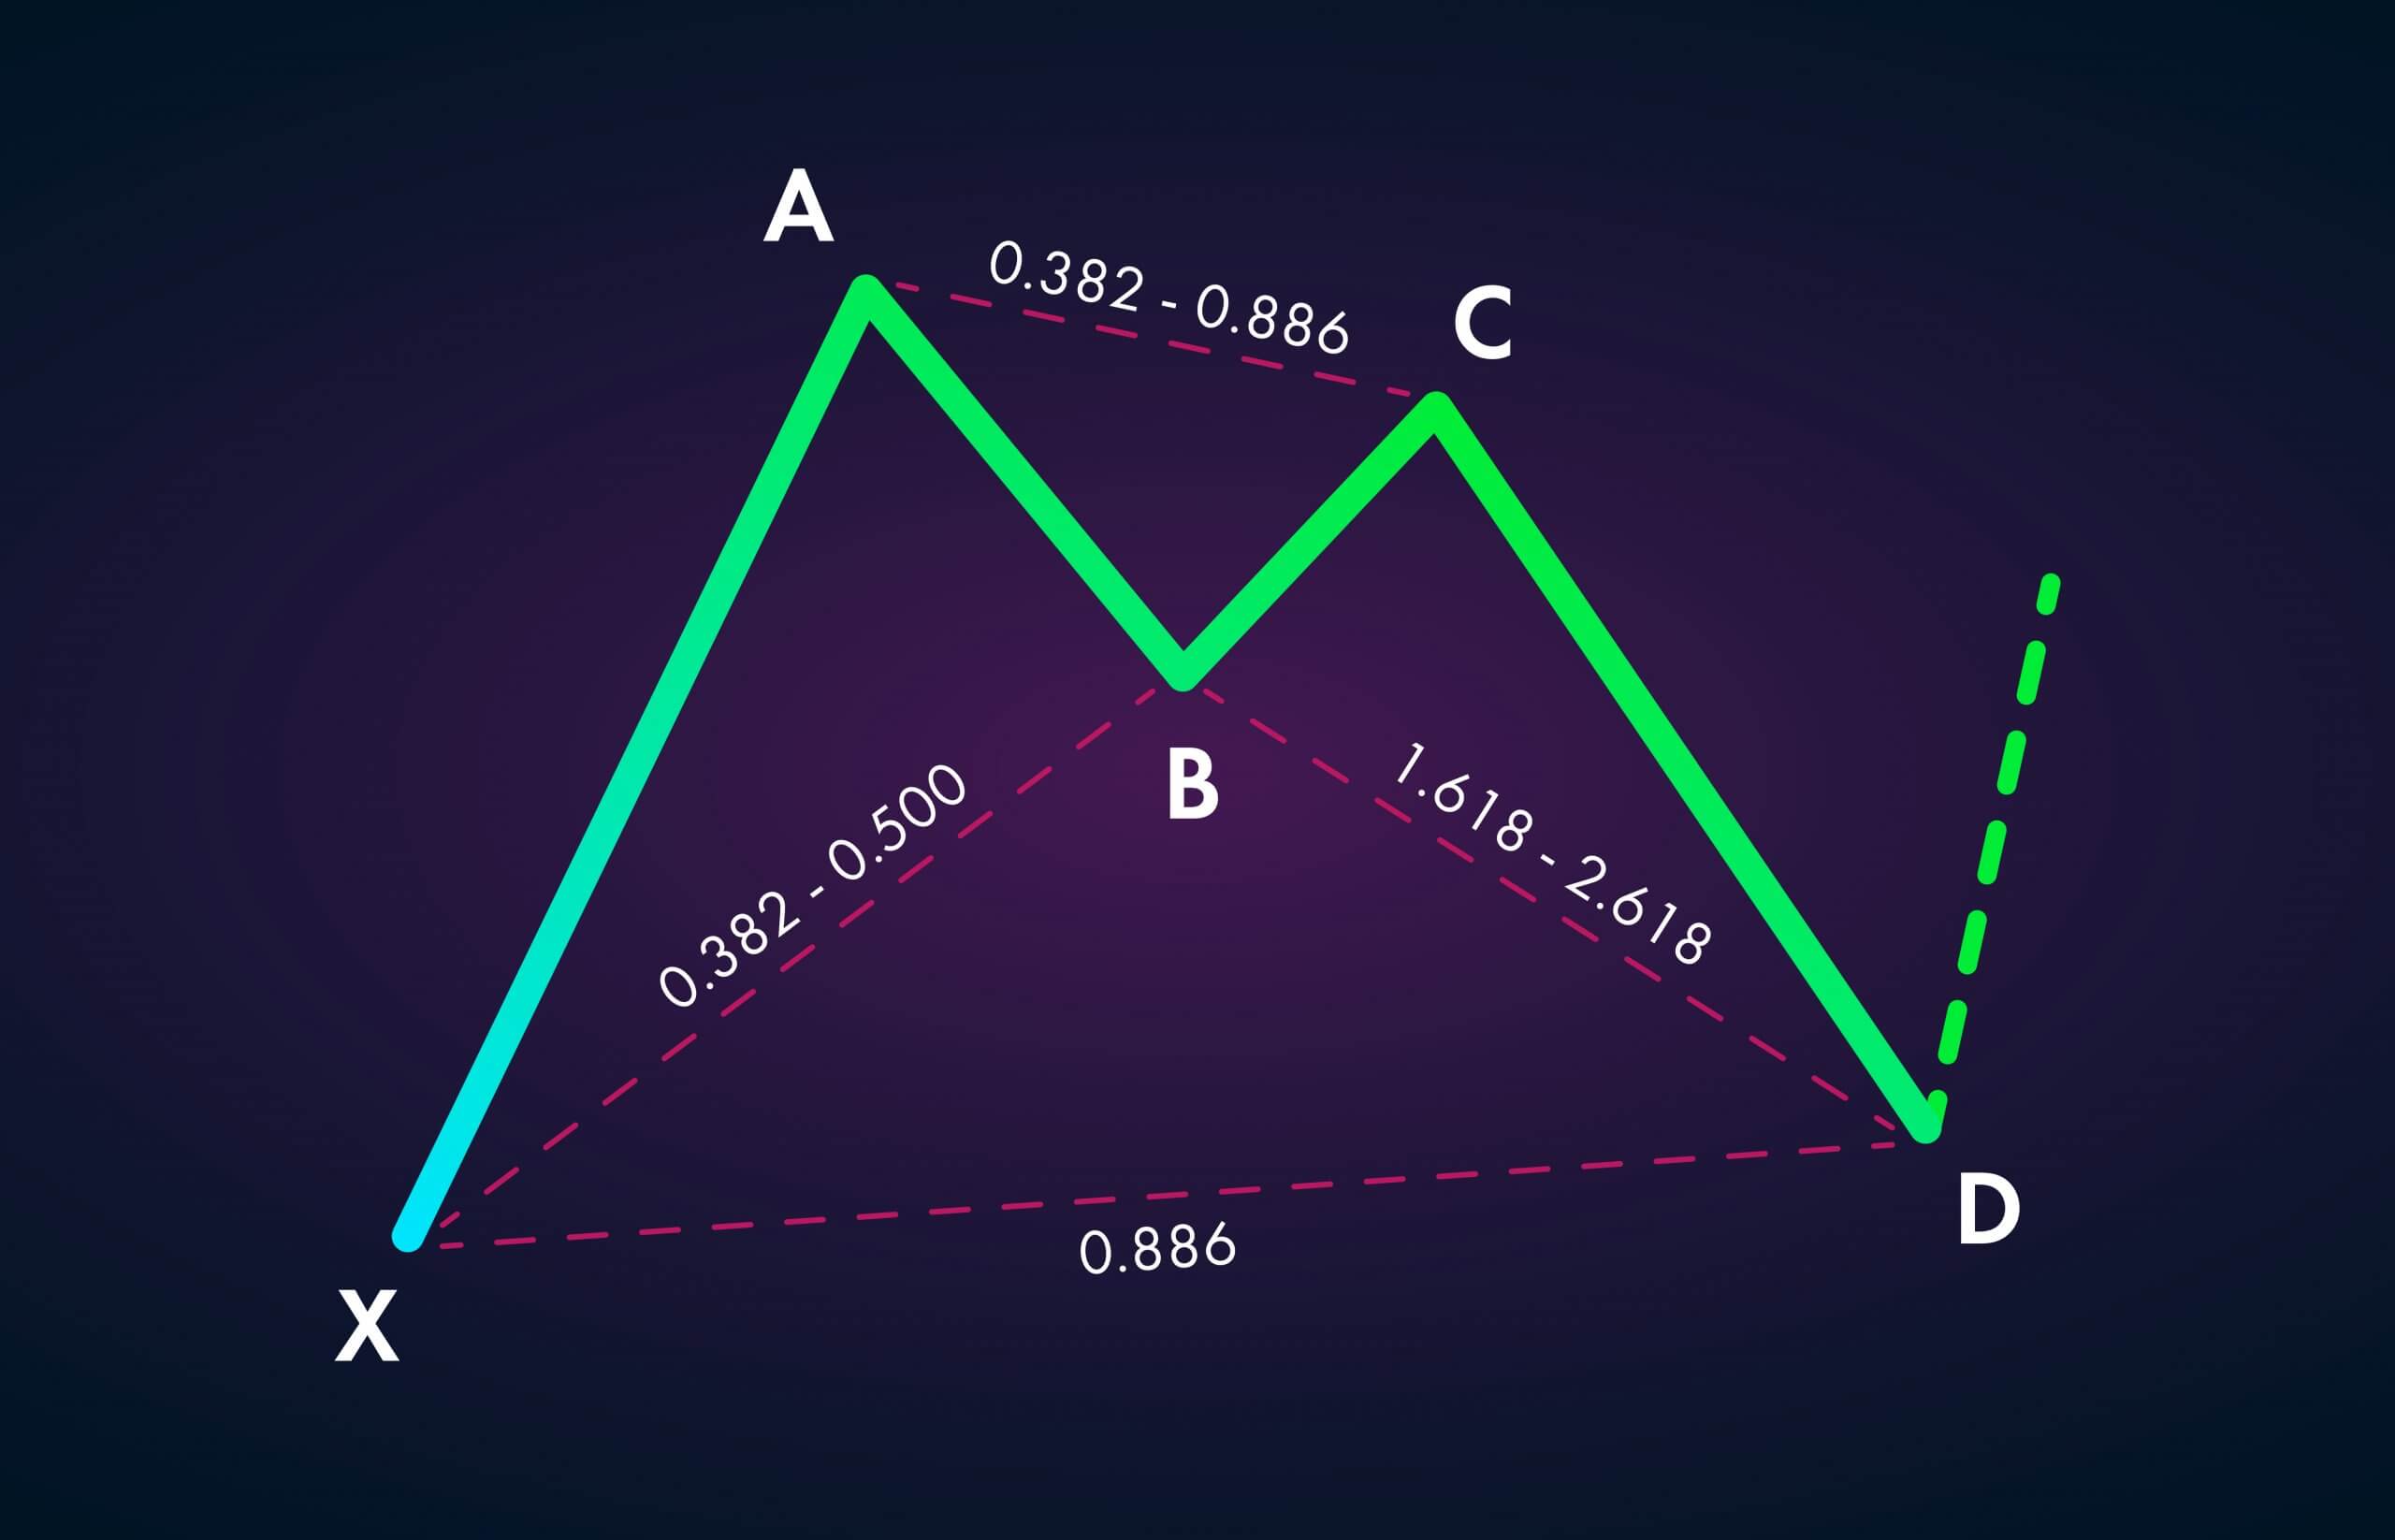
The bat pattern, like other harmonic patterns, is a four-wave recurring pattern based on specific Fibonacci ratios. These four waves include X-A, A-B, B-C, C-D.
To form this pattern, the following three Fibonacci ratios must be established:
The A-B wave should be between 38.2% and 50% Fibonacci X-A wave.
The B-C wave should be between 38.2% and 88.6% Fibonacci AB wave.
The C-D wave is at the level of 88.6% of the X-A wave or is between 161.8% and 261.8% of the A-B wave.

The first price move that we should pay attention to in identifying the bat pattern is the X-A move. Depending on whether the bat pattern is ascending or descending, the X-A wave is a strong up or down movement on the chart.
Next, we must note that the X-A wave has been corrected to a minimum of 38.2% and a maximum of 50% Fibonacci. This correction creates point B. A-B price movement can not continue below 61.8%.

Then the price returns from point B and continues to a minimum of 38.2% and a maximum of 88.6% of Fibonacci wave A-B. This price move creates a C point in the bat’s harmonic pattern.
The last thing we need to do is identify the D-spot. For this purpose, we determine the 88.6% level of the X-A wave, which forms the large C-D wave and completes the bat pattern. The move could also continue between 161.8% and 261.8% of the previous Fibonacci wave (B-C).
Bat Harmonic Pattern Trading Strategy
The trading pattern of the bat pattern creates a very good reward-to-risk ratio for the trade, and this is the reason for the popularity of this pattern. The entry point in this pattern is point D, which is the 88.6% Fibonacci level of the X-A wave.
It is recommended to enter the trade immediately after touching the 88.6% level by the chart. Because most of the time, the bat pattern does not extend beyond this range.

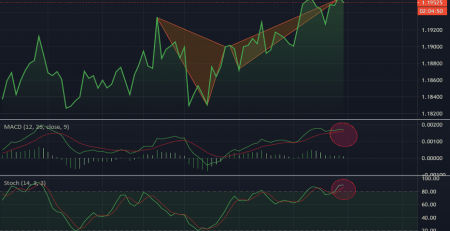
The image above shows the dollar-to-yen chart in 4-hour timeframe. In this chart, a bullish pattern is seen, after which the purchase signal is issued.
Bat loss pattern (Bat)
Determining the amount of losses in transactions is a must. In the bat harmonic pattern, the loss limit is below the X point. This is a reasonable place to limit losses. Because if the price crosses this range, the pattern will be invalid.
The next step in the bat trading strategy is to determine the profit margin.
Profit limit in bat pattern (Bat)
There are many ways to manage transactions. But the optimal profit in this model can be the implementation of multiple profit limits. In this strategy, half of the trading position is closed at point C and the rest after the price reaches level A.
Once the price reaches point C and half of the profit is identified, you can move the loss limit from point X to point D (head to head).
This method of profit recognition is very reasonable. Because we can be sure that part of the trading position in the first resistance range has been liquidated and the price in this range may return in the opposite direction of our trade. If the price touches the first target, we change the loss limit to the point of entry into the trade. Therefore, if the price returns, we will not be harmed in this regard, and the rest of the transaction will be closed at the end point.
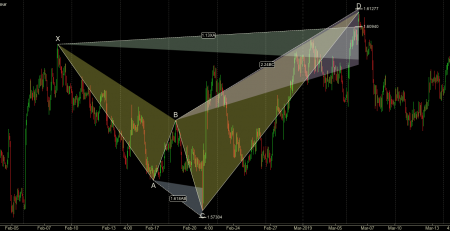
Below, you can see a harmonic pattern of a descending bat whose chart has reached the first target but failed to touch the second target.
Summary
The Bat Pattern harmonic pattern has a very high success rate and has a relatively small loss margin compared to most other harmonic patterns.
It is important to note that the effectiveness of the bat pattern is achieved by its formation at the support and resistance levels. One of the key features of the bat pattern is that when the chart reaches 88.6% return to Fibonacci, the price returns slowly.

Leave a Reply