Gartley harmonic pattern and how to trade based on it
Gartley harmonic pattern and how to trade based on it : Gartley model has many fans among technicians. Because this template provides very accurate conditions for assessing the validity of the template, and also when the template is used properly, the reward-to-risk ratio is high for entering the trade. There are different harmonic patterns for price prediction. But the Gartley pattern is one of the oldest harmonic patterns identified, and here we are going to explain the rules and how to trade based on this pattern.
What is Gartley pattern?
Gartley is a special graphic pattern that is in the category of harmonic patterns. This pattern, like other harmonic trading patterns, must meet certain ratios of Fibonacci levels in order for the pattern to be valid. A man named Mr. Gartley, who lived in the time of Elliott and Gann, introduced the Gartley model in a 1935 book, Profit in the Stock Market. On page 222 of this book, the Gartley pattern is described as one of the best trading opportunities in the market, and some traders now refer to the Gartley pattern as the Gartley 222 pattern or the 222 pattern.
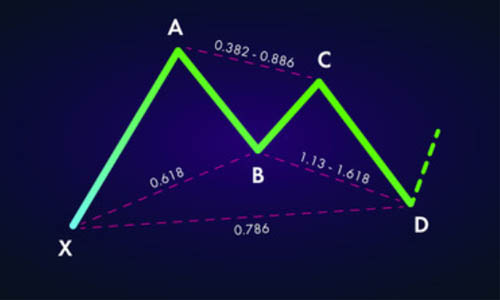
Depending on whether the Gartley pattern is ascending or descending, it forms a shape similar to the Latin letter M or W on the chart. Therefore, this pattern includes 5 points in the price chart. These points are indicated by the Latin letters D, C, B, A, X. The general shape of the Gartley pattern is as follows.

The Gartley pattern begins at point X, forms four more oscillating points, and ends at point D.
Gartley Harmonic Pattern Rules
Since this pattern is from the family of harmonic patterns, any price fluctuation must continue to a certain level of Fibonacci ratios. Below we describe the structure of Gartley.
X-A move: X-A move can be any price move on the chart. There are no special conditions for X-A motion in the formation of the Gartley pattern.
Motion A-B: Motion A-B should be about 61.8% of the size of X-A. Therefore, if the X-A move is bullish, the A-B move should fall to a limited 61.8% Fibonacci retracement.
B-C motion: B-C motion must be in the opposite direction of A-B motion. Meanwhile, the B-C move should end in the range of 38.2% Fibonacci to 88.6% Fibonacci of its previous wave (A-B).
C-D motion: C-D motion is the opposite of B-C motion direction. The C-D movement should continue in the Fibonacci range between 127.2% to 161.8% of the B-C wave.
A-D Motion: The last rule of the Gartley model is that the A-D movement should end at the 78.6% Fibonacci level of the X-A wave.
The following figure shows a summary of the above rules.
If the above five rules are followed, you can be sure of a Gartley pattern on the chart.
What is the result of the Gartley model?
What happens after the Gartley pattern is confirmed depends on whether the Gartley is an ascending Gartley or a descending Gartley.
Ascending Gartley pattern
The ascending garter is as shown above. In this type of Gartley, the X-A wave is the first upward movement. Then the A-B motion is downward. B-C is bullish and again C-D is bearish.
In this case, the price is expected to return from point D. In fact, the rise of the Gartley is a price increase from point D.

In the image above, the green arrow indicates the potential price movement after the formation of the uptrend. The last price target of the model is the level of 161.8% Fibonacci A-D. But before the price reaches the last target, the chart crosses the three price targets as follows.
1 Objective 1: Point B.
2 Second goal: point C.
3 Objective 3: Point A.
4 Fourth Goal: Point E (161.8% A-D)
These four levels in the chart are the minimum price targets. This means that when the price reaches point E, the uptrend does not end. You can always use additional rules or follow the stop loss of the follower to be more in line with the trend.
Gartley pattern descending
A descending Gartley pattern is just like an ascending Gartley except that everything is reversed. In a descending gear, the X-A is the first move to descend. Then A-B is bullish, B-C is bullish and C-D is bullish. In a descending garter, the price drops from point D. The target price in this pattern is as bullish as Gartley. This means that the price will be reduced by 161.8% of Fibonacci A-D movement. In the image below, you can see a descending garter and its target price.
As you can see in the picture, the descending garter is exactly the same as the ascending garter. But everything is upside down. So this pattern has similar price targets to the ascending Gartley.
1: Point B
2: Point C
3: Point A
Goal 4: Point E (161.8% A-D)
Similarly, reaching the E point is not the reason for the end of the downtrend. You can follow the trend using other rules, such as Price Action and Stop Loss.
Gartley Model Trading Strategy
Now that you are familiar with Gartley identification rules, you can easily trade according to this chart pattern. In the following, we will show you the appropriate point to enter the transaction, the loss limit and the profit limit.
Entry point based on Gartley
In order to enter into a transaction based on the Gartley pattern, you must first identify the pattern and then validate it. To draw a Gartley pattern on a chart, you need to mark four price movements on the chart and check that each price wave is at its Fibonacci level. Mark the price movements with the letters X, A, B, C, D. This way you can have a good understanding of the overall size of the template. If a bullish garter appears on the chart, you can enter into a buy trade provided the following two conditions are met.
The C-D wave is supported in the range of 127.2% to 161.8% of the B-C wave.
Prices climb within the relevant Fibonacci ranges.
Similarly in a downtrend you enter a sell position when the above two rules are met in reverse.
Loss limit in Gartley pattern
Regardless of whether your entry signal is a buy or sell, it is always necessary to determine the loss limit in trades. This protects you from any rapid and unforeseen price movements. If you enter into a buy trade based on an uptrend, your loss limit will be exactly below point D. Also, if you enter a sell position based on a downtrend, your loss limit will be higher than point D. The image below shows the proper location of the loss limit in the ascending garter.
Profit limit in Gartley model
When you open a trading position, you set the loss limit and expect the price to move in the direction you want. But you should know how long you should keep the trade open if the price moves according to your forecast.
As a trading method in the Gartley pattern, we can enter the trade after the price moves after point D. As mentioned earlier, price targets are as follows.
1: Point B
2: Point C
3: Point A
Goal 4: Point E (161.8% A-D)
After the chart reaches a price target, we close some trading positions and allow the open part of the trade to move if there are signs of continuing the trend. We will continue to do this until all trades are closed at the final price target. You can use trend support techniques, trend lines, channels and candlestick patterns to measure the strength of the trend and select the end point of the exit. In general, if you do not see any signs of trend change, keep your trade as long as possible.
Sample transaction based on Gartley pattern
Now we want to apply the above rules to the actual chart. We open the trade after identifying the pattern rules and the price return from the level of 127.2% to 161.8% Fibonacci B-C wave. Then we place the loss order after point D and try to maintain the last price target of the trade. We will see later what this deal will be like.
An example of an ascending Gartley
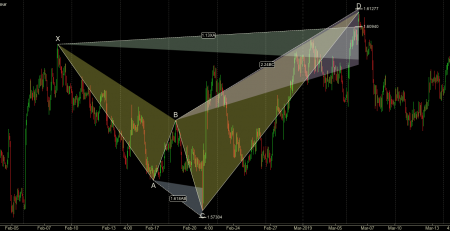
The image below shows an example of an ascending Gartley pattern.

The chart above shows the Newland Dollar / US Dollar pair in weekly timeframes. In the image above, X-A is ascending, A-B is descending, B-C is ascending and C-D is descending. A-B is at the 61.8% level of the X-A wave, B-C is at the 88.6% level of the A-B wave and C-D is at the 161.8% level of the B-C wave. At the same time, A-D is at the level of 78.6% of the X-A wave. Therefore, the existence of an uptrend in the New Zealand dollar / US dollar chart has been confirmed.
Since we have an ascending garter, the price is expected to increase. So we prepare for the New Zealand Dollar / US Dollar pair. We do this when the C-D ends at 161.8% B-C and the price has moved up. When this happens, we place our loss limit below point D, as in the image above.
Gartley harmonic pattern and how to trade based on it
The first price target is at the level of point B. The increase after point D is usually sharp and rapid. Therefore, it traverses the first target diagram (B) very quickly. The second price target is point C, where 7 candles are completed after purchase. Then, 10 weeks later, the price reaches the third target, point A. At this time, we still have the last price target. This price target is at the level of 161.8% Fibonacci A-D. It will take more time for the price to reach this goal. The price of 27 candles has reached 161.8% A-D after the third target.
We can keep our trade after the last price target to make more profit. As you can see in the chart, the other two peaks are created after the last price target. Note that the floors adjacent to the peaks have created a small trend line (yellow line) that we can use as the last exit point of the trade. The break of this trend line is very sharp and has been done with a big downward candlestick. At this time it is better to close the whole deal and identify our profit.


Leave a Reply