How to trade based on AB = CD pattern?
What is the pattern AB = CD?
The ABCD pattern is one of the harmonic patterns used by technical analysts to predict prices. Some traders refer to the ABCD pattern as the AB = CD pattern. Therefore, in this article, both expressions are used with the same meaning.
The ABCD pattern can be called the simplest harmonic pattern. One of the reasons it is easier to count is the much lower requirements for forming this pattern than other harmonic patterns. Also, the ABCD pattern can be identified much more easily in the price chart. The shape of the pattern AB = CD is as follows.

The behavior of the chart in the ABCD pattern begins with the price moving in a new direction (A). This movement then continues to an important level (B). It then returns from point B part of the previous wave motion (C) and then continues its previous path as far as distance A to B (D) as it passes through point B. The price is expected to return when the CD wave moves as much as the AB wave. Simultaneously with the formation of these waves, BC and CD must be at specific Fibonacci levels. Once the AB = CD pattern is approved, traders try to place their entry points immediately after the CD moves (beginning of the price return).
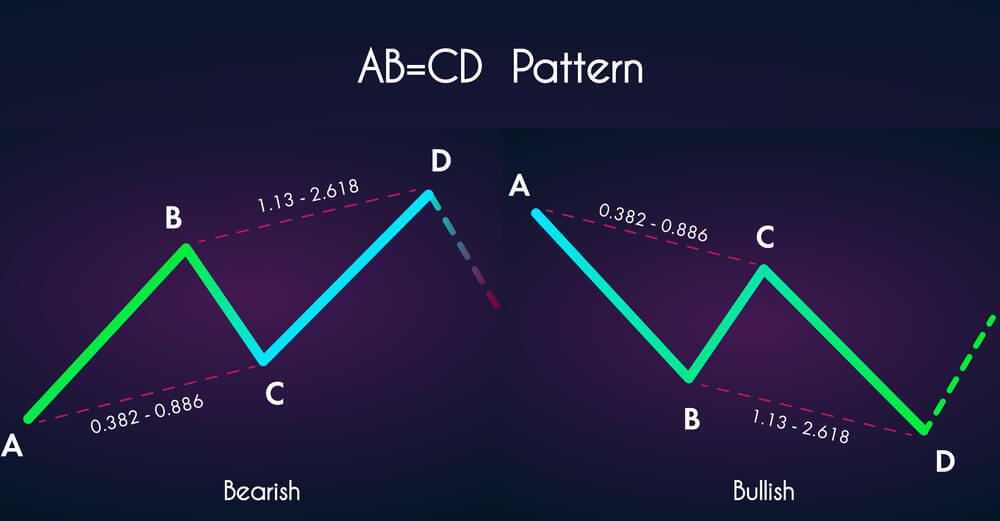
There are two types of ABCD patterns: AB = ascending CD and AB = descending CD
AB = Ascending CD
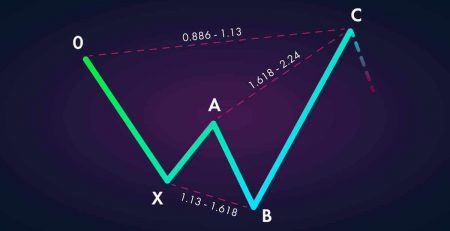
The bullish ABCD pattern starts with a price decrease (AB) and then the price returns and rises (BC). After BC, the price changes direction and enters a new bearish movement (CD) that crosses the price floor created by point B. You can see this connection in the figure below.

This is a standard AB = CD ascending pattern. Prices are expected to return and rise once the CD movement is complete. This price increase is indicated by the blue arrow in the figure above.
AB = descending CD
The pattern AB = CD descending is exactly the same as AB = CD ascending, except that everything in it is the opposite of ascending ABCD. The pattern starts with an ascending line AB that decreases with the new BC movement. BC then returns and rises (CD) during which the price crosses the peak created by point B and rises. When you see these features in the price chart you can expect another price reduction.

The potential downtrend in this pattern is indicated by the blue arrow in the figure above.
Note that three price movements are required to complete the AB = CD pattern: AB movement, BC movement and CD movement. We only start trading when the CD has moved as much as AB.
As you can see, the ascending and descending ABCDs are symmetrical and have similar trading rules. But the direction of the trade (buy or sell) in each pattern will be different for the trader.
Fibonacci ratios in the pattern AB = CD
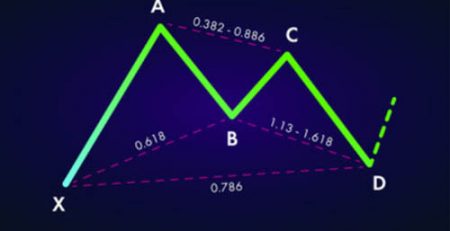
The pattern AB = CD must be formed in certain Fibonacci ratios. Below are the Fibonacci levels of the AB = CD trading pattern.
BC returns as much as 62% of Fibonacci AB.
The CD changes as much as 127% of Fibonacci BC.
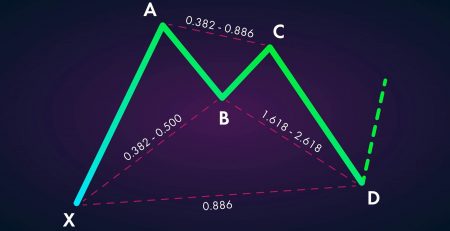
To confirm the ABCD pattern, you should always consider Fibonacci ratios. There are many Fibonacci indicators in technical analysis software to confirm the ABCD pattern. You can see the Fibonacci ratios with the pattern in the figure below:

As you can see in the figure above, BC should be 62% AB and CD should be 127% BC. Simultaneously with these Fibonacci ratios, AB and CD must have traveled the same distance and formed in about the same time period. In other words, if you find in the chart, the movement AB = CD, which is governed by the mentioned Fibonacci ratios, you can consider it as a strong signal with a high probability of occurrence.
Trading system AB = CD
For traders who are new to harmonic patterns, the ABCD pattern is a good place to start. Because this pattern is a special pattern, it also has its own trading rules. If you learn how to implement these rules, you can use them well in your transactions.
Entry point AB = CD
In order to be able to enter the market based on the AB = CD pattern, we must first make sure that the pattern is formed. This means that you have to find two parallel price movements of the same size (AB = CD). At the same time, BC should be at the level of 62% Fibonacci AB and CD at the level of 127% Fibonacci BC. Also, AB and CD are formed in the same time period. If you recognize all the conditions mentioned in the price chart, you will find a valid AB = CD pattern.
Once the template is approved, you should enter the market when the CD has changed by 127% BC. You must enter the transaction in the opposite direction of the CD.
The image above shows a descending ABCD pattern. Once the CD has moved as much as 127% BC and started to decline, you need to take a sell position in the market.
We do the same in the ascending ABCD pattern, except that everything will be the other way around.
Loss limit in pattern AB = CD
When you open a trading position according to the ABCD pattern, to protect your capital in the event of an unexpected price move, you must set a certain loss limit for the trade. The right place will be your loss limit after the last point of the CD.
The figure above is the same as the previous image. With the difference that we have marked the appropriate place of the loss limit with a red line in it.
As mentioned earlier, the ABCD pattern gives us the opportunity to enter into a trade right at the beginning of the price return. In other words, we create the transaction in the emergence of a new trend. This means that our entry point and loss limit are very close to each other. Therefore, in the ABCD model, we can have a very good reward-risk ratio.
Determining the profit limit in the pattern AB = CD
The minimum price target that can be imagined in the ABCD pattern will be the same size as the previous move, the CD wave. Thus, the starting point of the CD will be your price target. You can see the profit limit as shown below.
The wave that is expected to appear after the CD should reach the 100% Fibonacci CD return point. In other words, the price movement after the CD must be equal to the CD. However, this is the minimum motion potential of the graph. In other words, price movements may go further than this, and this can be an opportunity for us to make more profit by maintaining part of the trading position. For example, after the price reaches 100% Fibonacci, you can identify the 50% profit of the trading position and keep the remaining 50% of the trade open for more profit. But if you do, you should monitor the market using other technical analysis tools such as trend lines, resistance and support levels, price channels and patterns, or candlesticks. In this way, when you find an acceptable thread to reverse the trend, you will identify your profit by leaving the market.
A real example of the ABCD pattern
Now that we have examined the ABCD model and learned its trading rules, we combine them all to create a complete trading strategy.
We analyze the graph based on AB = CD. The next important step is to validate and validate the template. This means that we need to evaluate BC to make sure that 62% of AB has returned and that the CD has continued to move as much as 127% of BC. At the same time AB and CD should be the same in terms of time and price changes.
If the pattern is bullish, we can enter the buy position and place the loss limit below point D. Then we have to stay in our position until the price returns at least to level C. And if the pattern is down, we open a sell position and set the loss limit above point D. Then we stay in our position until the price drops to level C. Below is a real example with the figure.

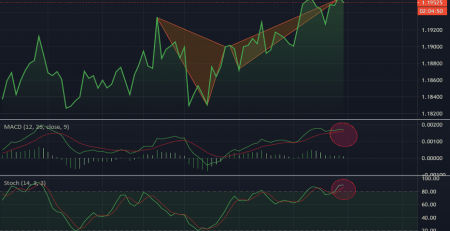
The chart above shows the Pound / Dollar currency pair drawn in the four-hour timeframe as of July 2014. Our analysis shows that an AB = CD pattern is formed in the diagram. The pattern is marked on the chart with blue lines. Black horizontal lines indicate Fibonacci levels. You can see that AB is almost equal to CD. AB is also formed in about the same time as CD. BC has returned to 62% Fibonacci AB and the CD has moved up to 127% Fibonacci BC. Therefore, the ABCD pattern in the diagram is confirmed.
As you may have noticed, we have a bullish ABCD pattern here. Because the fluctuations of AB and CD are decreasing. So in this case we expect a price increase.
CD movement has moved up to the 127% Fibonacci BC range and has shifted upwards there. Immediately after identifying this change of direction, it will be time to enter the buying position. You should set your loss limit below the lowest CD price as shown in the red line chart.
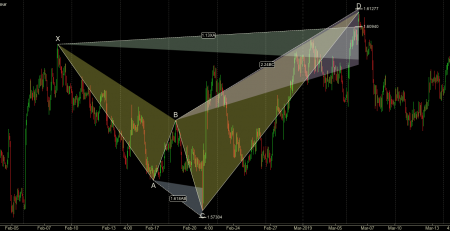
The pound / dollar chart began to rise after the price hit the 127% Fibonacci level several times. A few weeks later, the price reached the minimum price target of the model. In other words, the price rose to level C. Here we have two suitable options. Closing our trading position and identifying the total profit or closing part of the position and allowing the rest of the trading position to grow further.
In the case of this transaction, if you decided to keep the position, your risk was rewarded. The price on the way up has only created higher floors and has not re-descended to any support range, which has further strengthened our buying position. So the best thing to do is to hold more trades until the price breaks one of its support levels. This happened on July 4, 2014, when the pound / dollar fell below its previous floor, which we have marked with a yellow line in the chart. This was a signal to exit the deal.
Note that the minimum price target of the ABCD model in this example was only half of the total price movement. This shows how important it is to keep the winning trade in the market as much as possible.

Leave a Reply