Harmonic pattern of crab and deep crab
Harmonic trading is a type of technical analysis that is widely used in the Forex, futures and stock markets. Harmonic trades use certain price patterns that are created based on certain Fibonacci ratios.
Thus, by combining the pattern structure and Fibonacci ratios, potential price return areas are identified in the chart.
Harmonic patterns are recursive patterns and can show us a possible change in price direction. This reversal may be a temporary price correction or a trend reversal. No technical indicators other than recursive Fibonacci instruments and Fibonacci extensions are used in harmonic transactions.
Other important harmonic patterns include the Gartley pattern, the bat pattern, the butterfly pattern, and the shark pattern. In order to be able to effectively use harmonic patterns, especially the crab pattern and the deep crab pattern, you must have a thorough understanding of the structure of these patterns and the specific Fibonacci ratios to confirm them.
Sometimes even a small change in Fibonacci levels can invalidate the pattern or change it from one type to another.
What is the harmonic pattern of a crab?
The crab pattern was discovered in 2001. Like other harmonic patterns, the crab pattern is a recurring pattern. So we have a bearish crab pattern that warns of a price drop, and we have a bullish crab pattern that announces a bullish price return.
Like all harmonic patterns, price movements in this pattern change direction at certain levels. These price movements start from a ceiling or floor and are indicated by the Latin letters X, A, B, C, D. In some harmonic patterns, you only deal with the four points X, A, B, and C.
The crab pattern is distinguished from other patterns by the sharpness of the CD. This move is usually as much as 1.618% of the first wave Fibonacci extension, the XA.
Of course, there are rules that must be followed in order for us to approve the crab pattern. These rules are as follows:
- After moving the XA, point B should be between 38.2% to 61.8%. XA returns should ideally be less than 61.8%.
- AB moves in the opposite direction to its previous wave trend, XA.
- The next move, which is BC, continues between 38.2% to 88.6% of the Fibonacci ratios of the AB wave. In this pattern, point C should never cross point A.
- After moving BC, the price returns again in the opposite direction of the XA wave. CD movement is the largest wave in the crab pattern and usually lasts up to 161.8% XA. Sometimes the size of this price movement increases and between 224% and 361.8% BC wave continues its way.
Once the criteria described in the chart are observed and the crab pattern is approved, a trading position is created after the CD is formed. Keep in mind that the CD wave does not always return near 161.8%. But once the chart begins to take hold, there is likely to be a good opportunity to trade.
It is always better to be patient until point D is formed and then enter into a good buy or sell deal.
The loss limit in the crab pattern is slightly higher or lower than point D. Also, the profit limit in this model is usually considered as A or B points.
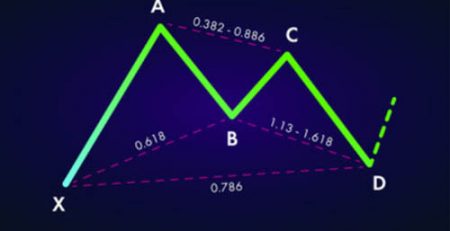
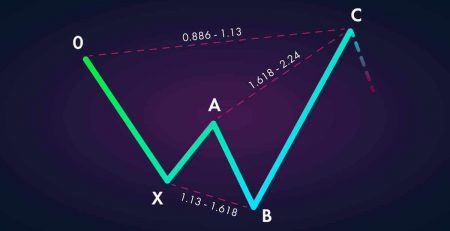
The image below shows the general shape of the ascending and descending crab return patterns.

In the image above, the arrows for the price and the intersecting lines show the Fibonacci ratios. As can be seen, the most distinctive part of the crab pattern is the movement of the CD.
Draw the crab harmonic pattern
It is difficult to remember all the Fibonacci ratios in the crab harmonic pattern. Also, using the Fibonacci tool to measure any price movement in the pattern can be tedious.
In addition to the basic rules of the crab harmonic pattern, traders can easily analyze the market by following the price peaks and peaks.
- BC motion is formed inside the XA.
- In descending crabs, point C forms a higher floor than point A. In the ascending crab, point C forms a lower ceiling than point A.
- In descending crabs, point B forms a lower ceiling than point X. In the ascending crab, point B forms a higher floor than point X.
- Point D is the farthest point. So that it forms the highest peak or the lowest floor and passes through the X point.
Below, you can see the pound to the yen pair in the 30-minute time frame in which the bearish crab pattern is formed.
Note that in this example, we used several Finocchi recursive and extension tools to illustrate the crab harmonic pattern.

In the diagram above, after XA moves, a lower roof is formed at point B. Using the Fibonacci ratios in the crab pattern, we can confirm the following:
The return of the XA movement is checked to reach 61.8%. As can be seen, the graph has barely reached this level and formed point B.
Point C is in the range of 38.2% to 88.2% of the AB wave.
Finally, the price rose to 161.8% Fibonacci XA, which is in the range of 222.4% to 361.8% CD wave.
After the price peak (point D), a sell position can be created with a loss higher than point D.
Crab pattern and butterfly pattern
The question that is often asked is what are the similarities and differences between the crab pattern and the butterfly pattern.
The two main differences are that in the butterfly harmonic pattern, point D ends at the 127.2% Fibonacci XA level. Also, point B should return up to 78.6% of the first wave.
In contrast, when we look at the crab pattern, the D-point ends at 161.8% of the XA wave, and our AB motion is between 38.2% and 61.8%.
Deep Crab Pattern
The deep crab pattern is different from the crab pattern in one way, and that is the size of the AB motion.
In the typical crab pattern, point B is between 38.2% and 61.8% of the XA wave. But in the deep crab pattern, point B is at 88.6% of the XA wave. However, point B may sometimes exceed 88.6%. But as long as it does not cross the X point, the pattern is valid.
It is good to keep in mind that in real diagrams, it is difficult to find all the pattern rules completely. You need to be more flexible, especially in identifying the deep crab pattern. Otherwise you may rarely find it.

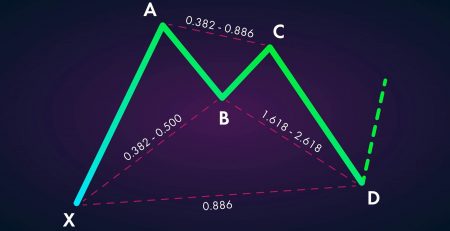
In the image above, you can see the general shape of the deep crab in ascending and descending positions.
The rules for identifying a deep crab pattern are as follows:
- After moving XA, the chart returns to 88.6% and point B is formed.
- The next movement after point B, which is the BC wave, between 38.2% to 88.6% of AB movement continues.
- CD movement returns up to 161.8% of XA wave. The CD continues at its highest level at 261.8% and 361.8% BC movement. But some analysts may consider the CD to be 200% to 361.8% valid.
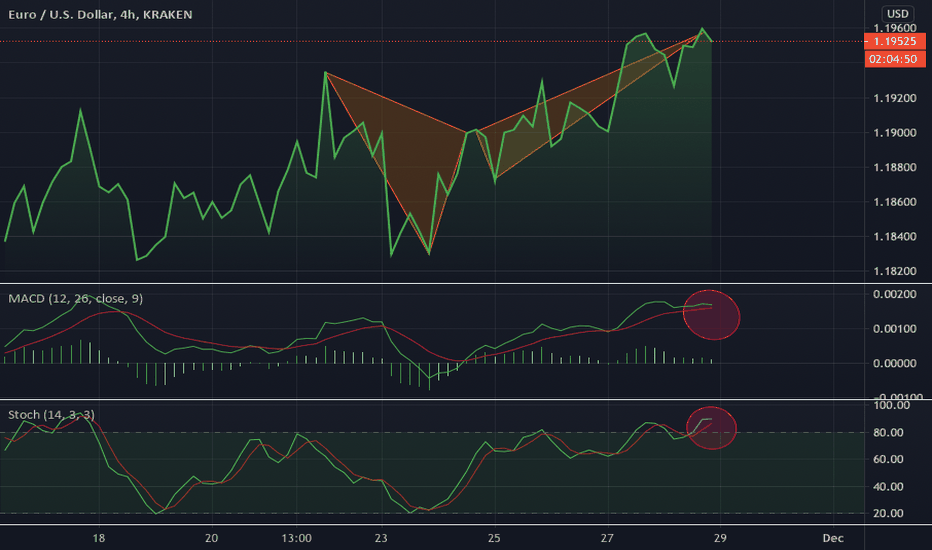
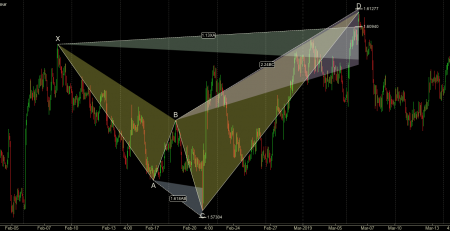
The following is an example of a deep down crab pattern in the Forex market. This pattern is detected on the chart. Keep in mind that this is not a complete pattern like what is seen in the rules of technical analysis. But this is a good example of the real world you might encounter in charts. Each trader must identify the pattern as valid according to their level of risk and trade accordingly.
In the chart above, a deep crab pattern is observed, during which the CD motion is located between 261.8% to 361.8% of the BC wave.
The loss and profit margins in the deep crab pattern are the same as in the crab pattern. Once the CD movement is complete, a buy or sell trading position is created. The loss limit is higher or lower than point D depending on whether you have opened a sell position or a buy.
The profit margin is equal to the level of point B or point A.
The deep crab pattern is less commonly seen in the graph. So finding a template with all its rules can deprive the trader of many lucrative trades. In this case, each trader decides to enter into a trade based on his experience.

Leave a Reply