Butterfly Pattern and deal with it
Harmonic patterns are very popular among stock market and forex traders. Harmonic patterns can be classified as both internal and external patterns. Internal patterns include patterns such as the Gartley pattern and the bat pattern. Exterior patterns also include structures such as butterfly pattern and crab pattern.
In this article, we will look at the license pattern and how to trade profitably based on this pattern.
What is a Butterfly Pattern?
The butterfly pattern is one of the recursive patterns that is classified in the category of harmonic patterns. This pattern shows the price density and is usually seen at the end of an extended price movement. Traders can use the license pattern to mark the end of a trend and start a price correction or start a new trend. In the Elliott wave count, this pattern is usually seen in the last wave (wave 5) of the motivational waves.
Butterfly harmonic pattern structure
The butterfly pattern has four price movements. The appearance of this pattern in the descending trend is similar to the Latin letter M and in the uptrend similar to W. This pattern may be confused with the twin roof or floor pattern at the time of formation.
The difference is that the butterfly pattern is not necessarily observed after a process, but it usually is. In contrast, the twin floor and ceiling patterns appear after significant movement.

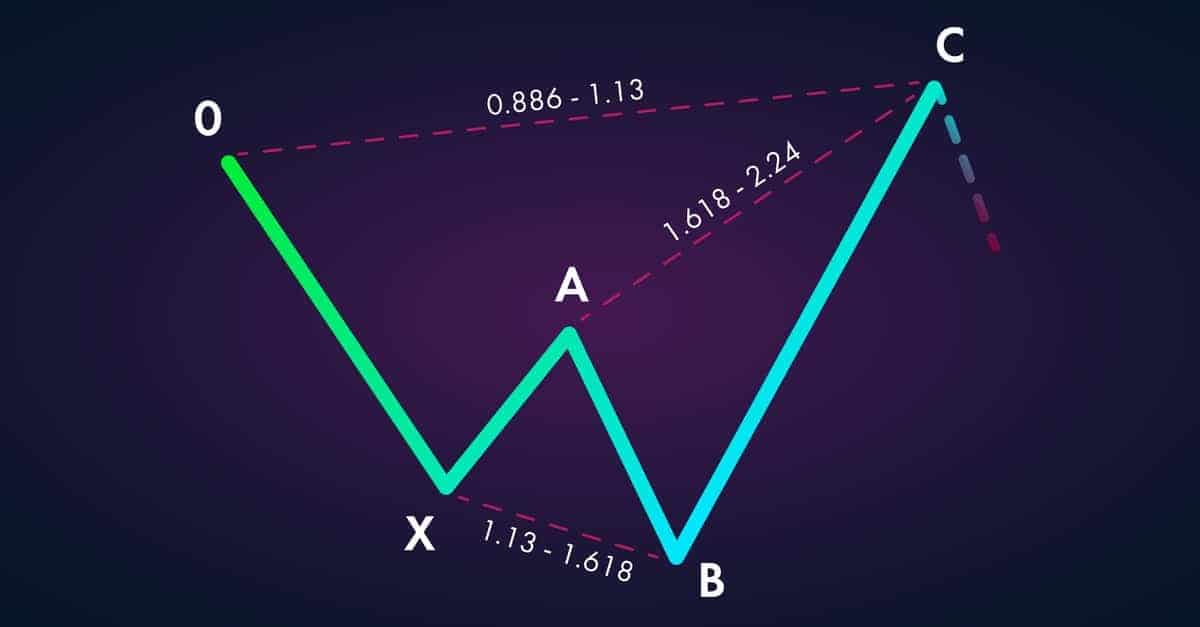
Note that the pattern starts with the letter X and then we see four price movements: CD, BC, AB, XA
Butterfly pattern and Fibonacci levels
There are several distinct levels of Fibonacci that are critical to correctly recognizing the butterfly pattern. As you know, Fibonacci ratios are a major component of the structure of harmonic patterns, including the butterfly pattern.
In order to be able to correctly identify a butterfly pattern in the chart, you need to make sure that the price movements correspond to certain levels of Fibonacci.
Let us now take a closer look at the relationships between Fibonacci ratios and the shape of the butterfly pattern.
XA move: This wave is the first move of the pattern. No special rules are required to form this movement and it can be any wave.
Motion AB: Point B is the most important level of the impeller pattern, which should be at 78.6% of the FA wave of the XA wave.
BC movement: BC movement should continue until the Fibonacci retracement of 38.2% or 88.6% of the AB wave.
CD Motion: If BC is 38.2% of the AB wave, the CD wave is likely to reach 161.8% of the BC wave. But if BC is as much as 88.6% of the AB wave, CD motion is likely to continue up to 261.8% of the BC wave.
AD Motion: Finally, the total AD motion, which includes BC, AB and CD waves, should be at the level of 127% or 161.8% of the XA wave.
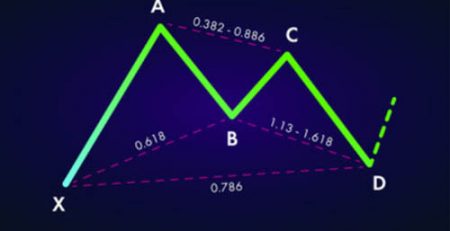
Now, you can see the above mentioned relationships in the form below.

Note that the Fibonacci BC and CD levels are shown in two different colors, green and blue. Green numbers are related to each other and blue numbers are also related to each other.
As described above, if the BC wave continues up to 38.2% of the AB wave, the CD wave should be at 161.8% of the BC wave. If BC reaches 88.6% of the AB wave, the CD will continue to move up to 261.8% of the BC wave. Of course, this is not a mandatory rule, but a general guide that you should be aware of. As mentioned earlier, in order for a pattern to be considered a butterfly pattern, point B must be at the 78.6% level of the XA wave, and this is a definite rule.
Ascending butterfly pattern
In this section, we want to know how the price will react in the ascending butterfly pattern after point D.
Note that the structure of the ascending impeller pattern is similar to the Latin letter M. In an uptrend pattern, the price is expected to rise after reaching point D. We see this price behavior in green in the image above.
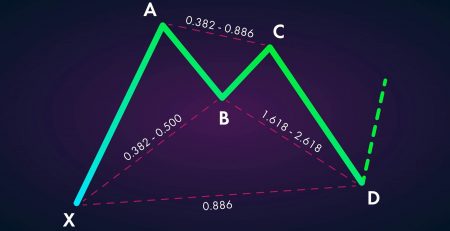
Descending butterfly pattern
The pattern of the descending impeller is exactly the opposite of the ascending impeller. Thus, the structure of the descending impeller is similar to the letter W. Below is a graphic image of a descending impeller.
As shown in the image above with the green arrow, in the descending impeller pattern, the price is expected to decrease after reaching point D.
Confirmation of the butterfly harmonic pattern for the transaction
The butterfly pattern is confirmed according to the location of point D. When signs of a reversal appear in the D-spot range, you should prepare for a new trade.
Butterfly Pattern Trading Strategy
Now that we know the general structure and how the price moves after the formation of the pattern, we will deal with how to trade based on this pattern. Keep in mind that there are different trading strategies for the butterfly pattern. But here we will look at a type of strategy that is to find point D based on BC motion. Now, it’s time to move on to the three most important parts of the deal: the entry point, the loss limit and the profit limit.
Entry point
If you trade according to the ascending license pattern, if after the price reaction at point D you enter the buying position that:
BC will react at the level of 38.2% of the AB wave and CD will create a price floor at the level of 161.8% of the BC wave.
Or BC react at the level of 88.6% of the AB wave and CD create a price floor at the level of 261.8% of the BC wave.
If you trade according to the pattern of the descending license, you will enter the selling position after the price reaction at point D:
BC will react at the level of 38.2% of the AB wave and CD will create a price peak at the level of 161.8% of the BC wave.
Or BC react at the level of 88.6% of the AB wave and CD create a peak floor at the level of 261.8% of the BC wave.
Loss limit
If you are trading using the bullish pattern, you should place your loss order below the newly created D-floor. If you are trading with a descending license, set your loss limit above point D.
Make sure that the loss limit is at a reasonable distance from point D and that the chart is allowed to fluctuate.
Profit limit
There are many ways to specify your exit point in the butterfly pattern. One of the efficient methods is to set a price target at the level of 161.8% of the CD wave. You may want to close part of the deal before this level in ranges B, A and C. These levels can be considered as potential return levels. So you need to carefully monitor price behavior at these levels to see if you should stay in or out of the position.
If the price breaks level A and crosses it, you can be somewhat confident that the chart will reach the 161.8% level of the CD wave.
The figure above shows the overall price target in a bullish butterfly pattern. Horizontally drawn lines show prices at points B, A, and C, which are potential resistance levels that are on track to reach the final target. Checking the price at these levels will help you better manage your trade.
In the license model, there is no specific price target order. Therefore, it is important to observe the chart to find the best exit position. All the above rules also apply to the downside license, with the difference that the price moves in the opposite direction.
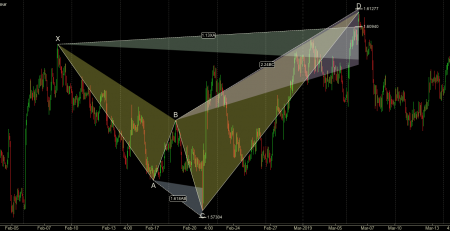
A real example of a descending butterfly pattern
The following figure shows a butterfly pattern.

The chart above shows the pair of pounds to dollars, which is drawn in a 4-hour timeframe. Prices are from August to October 2016. The red part of the chart shows the descending harmonic pattern.
The four price movements, which include BC, AB, XA and CD, are clearly visible on the chart. Also, price fluctuations have met all the requirements of a butterfly harmonic pattern, which are as follows:
- XA can be any downward movement on the chart.
- AB is back from 78.6% of the XA wave.
- BC is back from 38.2% of the AB wave.
- CD continued up to 161.8% of the BC wave.
The loss limit in this pattern is higher than point D, which can be seen in the diagram.
The pink levels in the chart indicate the areas of support we may encounter. Black arrows indicate the price reaction in these ranges. Notice how these surfaces turn from support to resistance after breaking. At each of these levels, sellers outperform buyers. This indicates the strength of the downtrend, which increases the probability of reaching the final price target.
Finally, the price of the pound / dollar pair reaches 161.8% of the CD wave and we can close the trade with a significant profit.
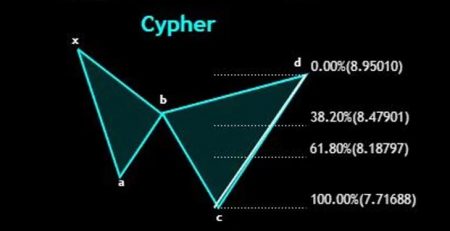
A real example of an ascending butterfly pattern
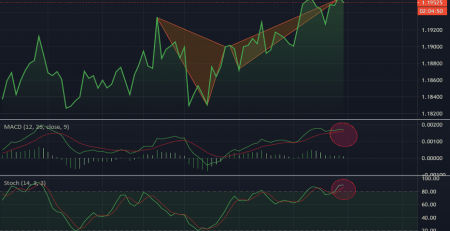
Now let’s take a look at the ascending butterfly pattern. In the chart below, you can see the image of this template.
The chart above is for the dollar-yen currency pair, drawn in a 30-minute timeframe. The chart shows the period between December 29 and 30, 2016. In the 30-minute timeframe of the ascending butterfly pattern . a good opportunity has been created to enter the purchase transaction. This pattern is marked with a red border. The fluctuations in this pattern are as follows:
- XA is a random uptrend on the price chart.
- AB has returned from the 78.6% XA level.
- BC continued up to 88.6% AB.
- CD lasted up to 161.8% BC.
The chart shows a reaction after the price reaches 161.8% of the BC wave. Also, this level corresponds to 127% of the XA wave. This is also a sign that makes us think that the price will not continue any longer. Note that the price floor at point D fluctuates sharply and immediately after reaching 127%, the price returned to the top.

Leave a Reply