Harmonic patterns
Harmonic patterns are geometric and price-specific structures that are measured by Fibonacci calculations. The application of harmonic patterns, which include distinct and continuous combinations of different Fibonacci ratios, is summarized in finding the length of price movements and reversals.
Identifying graph patterns is a basic skill that every technical analyst should develop. This may be a basic need, but finding skills and progress in this area requires repeated practice and observation of these patterns in the graphs. A more specialized understanding of chart patterns helps traders respond appropriately to an ever-changing market environment.
These patterns are first divided into “continuing” and “recurring” patterns, and then in the next step are called “simple” and “complex” patterns. The structure of complex patterns may consist of a set of simple patterns with a combination of previous price fluctuations. The greater the trader’s knowledge of pattern recognition, classification, and characterization, the greater the potential for adapting to a wide range of trades in financial markets.

Why are patterns formed?
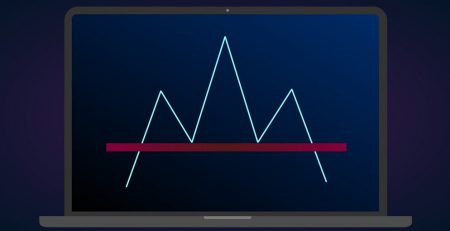
In different financial markets, prices move on a trend and rarely lose their trend suddenly. In technical analysis, the upward trend of price to downtrend and vice versa is identified by price patterns. In the process of converting trends to each other, the price experiences movements with less fluctuations and limited and transverse movements that define price patterns. These steps sometimes continue the predominant trend before them, in which case they are called continuation patterns.
Symmetrical triangle patterns, flags and cup patterns and handles are examples of this. Sometimes some patterns change their antecedent trend and form a trend contrary to their antecedent trend, in which case they are called reversible patterns; Such as head and shoulder patterns and twin ceiling or floor patterns.
Harmonic patterns
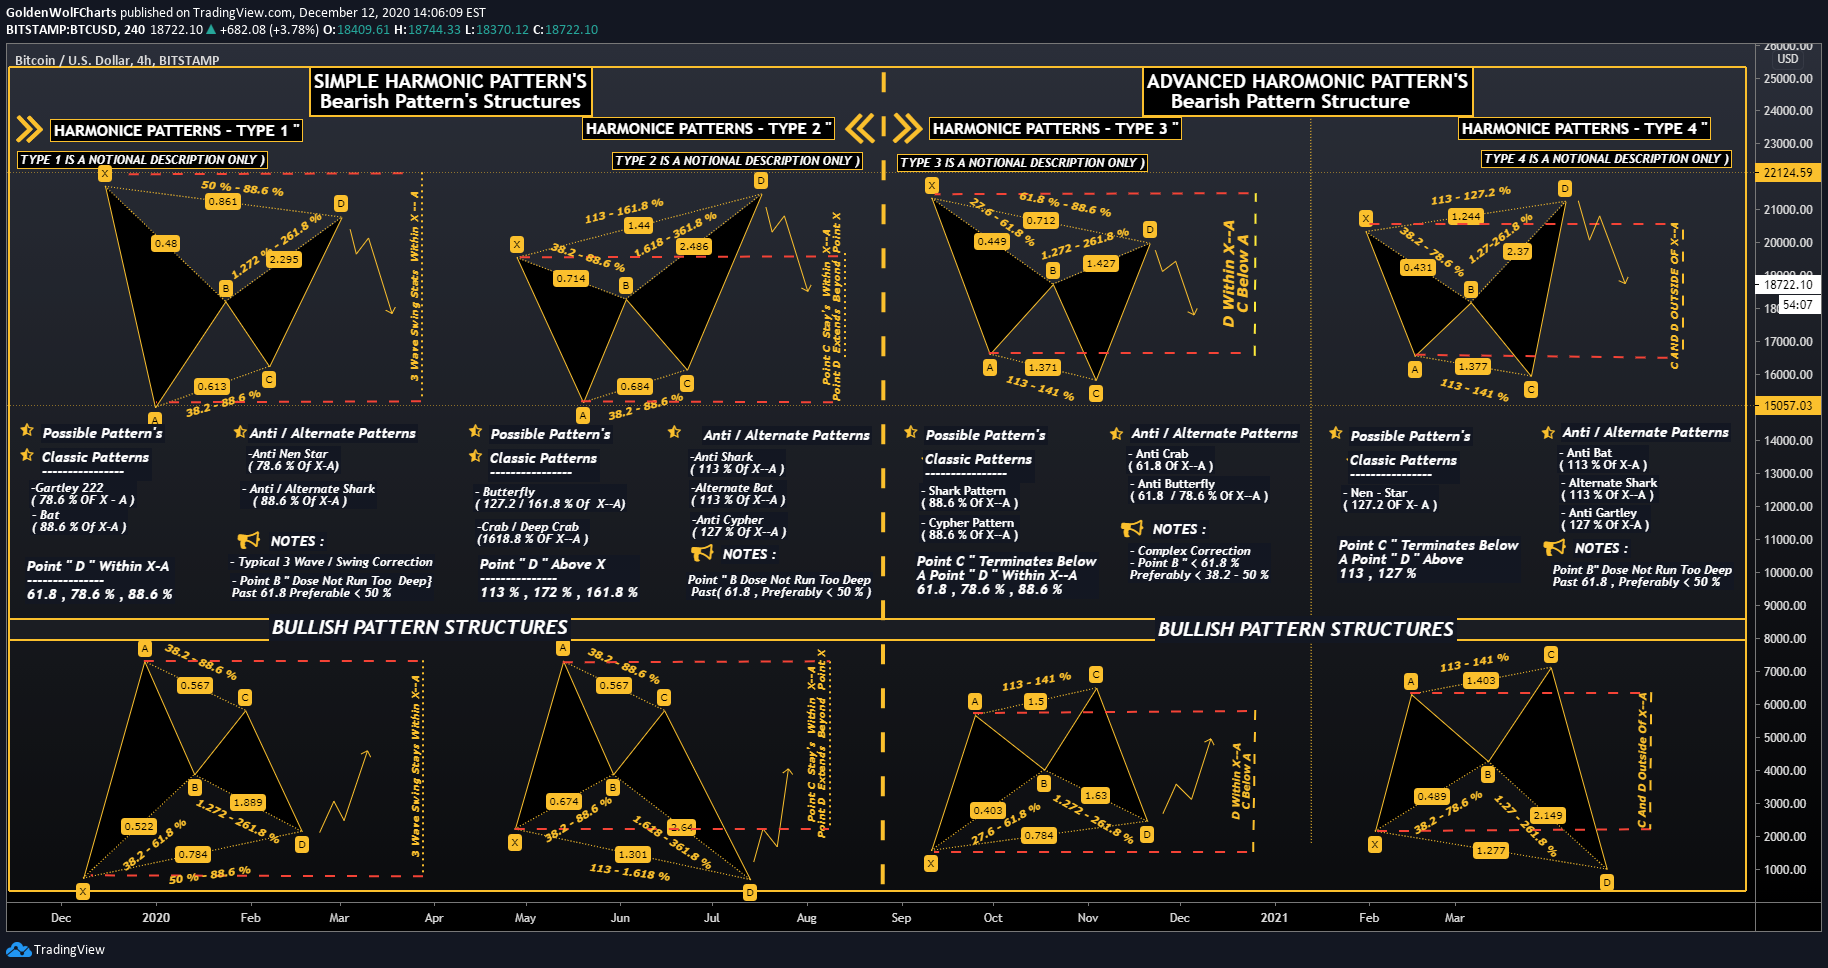
The idea of harmonic patterns was first introduced by H.M. Gartley in 1932 in the book Profits in the Stock Market. By combining this early pattern, known as the Gartley pattern, with Fibonacci ratios, Larry Pasavanto created the rules for trading with this pattern. Other authors have worked on Gartley’s theory, but perhaps the best example is Scott Carney’s book Harmonic Trading. He developed other harmonic patterns, such as crabs, bats, and sharks, and several others, which we will examine below, and added to the theory of trading rules and capital and risk management.
The main theory of harmonic patterns is based on the movement of price over time, which is based on the relations of Fibonacci ratios and their proportionality in the markets. Fibonacci ratio analysis works well in any market and time frame. The main idea of using these ratios is to identify key turning points, corrections or price spikes with high and low price turning points. The correction and throwing levels obtained from these turning points (ceilings and floors) determine the price targets and the loss limit.
Harmonic patterns create structures and geometric shapes in the diagram using a sequence of Fibonacci ratios. These structures, known as harmonic patterns, provide traders with a variety of opportunities, such as potential price movements and key turning points. These factors are useful for traders because they provide reliable information about prices, targets, and profit and loss limits, and this can be a key differentiation from indicators and how they work.
List of types of harmonic patterns
The following is a list of types of harmonic patterns, each of which can be formed in both descending and ascending states.
Ascending / descending ABC
AB = CD
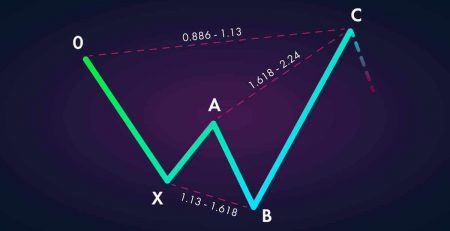
Three Drive
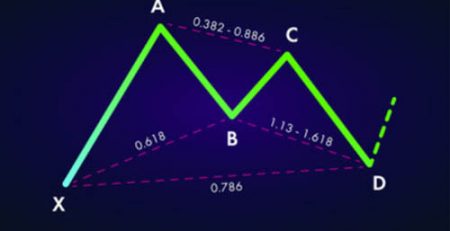
Gartley
the butterfly
Bat
Crab
shark
Cypher


Leave a Reply