
What is the pattern of head and shoulders in technical analysis? + Trading method
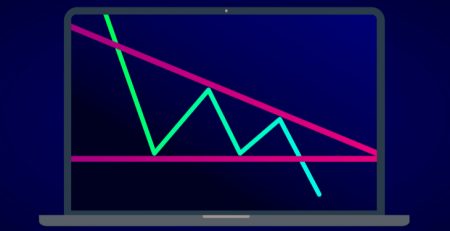
What is the pattern of head and shoulders in technical analysis? + Trading method, head and shoulders; A popular pattern in technical analysis is that when seen on the chart we should be prepared for a price drop and a terrible downtrend. In this article, you will first get fully acquainted with the head and shoulder pattern and the reverse (ascending) pattern, and then you will learn how to trade with the help of these patterns.
The Head And Shoulders model is one of the main models for technical analysis in financial markets. This pattern, which is one of the easiest patterns in terms of shape and is easily recognizable to most analysts, consists of a baseline (neckline) with three peaks (price ceiling) and the middle peak is the highest level.
The head and shoulders are a downtrend in the price chart of an asset and show the change of trend from ascending to descending. When an analyst confirms such a pattern, we find that the uptrend is probably over and the market is entering a downturn.

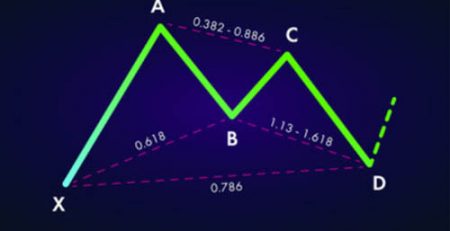
In addition, the same pattern can be used in reverse to change the trend from descending to ascending. In this case, the inverted head and shoulders (Inverse Head And Shoulders) or the same as the head and shoulders (Head And Shoulders Bottom) which is ascending, consists of a baseline and three valleys (price floor), so that the middle valley is at the lowest level Placed.
What is the pattern of head and shoulders in technical analysis? + Trading method
So the head and shoulders pattern is normally down and shows the price ceiling. If the same pattern is seen in reverse, it will be bullish and show a price floor.
The head and shoulders pattern can be found in all time frames (time frames) and therefore all traders and investors can use it. This chart pattern helps the trader identify important levels such as entry points, breakout (emergency sell) and price targets.
Do not forget that like all patterns, there is a possibility of error in the identification of this pattern by the analyst and you can never be 100% sure of completing a pattern head and shoulders.
Pattern shape in the chart
We will first look at the formation of the head and shoulder pattern and then examine its reverse pattern.
Head and shoulder pattern formation
- Left shoulder: increase in price, create a peak and decrease in price
- Head: Rising prices and the formation of higher peaks
- Right shoulder: re-price drop, increase to create the right peak of the pattern (with a height less than the head peak) and then a sharp drop in price
The head and shoulder pattern is seldom fully formed; In fact, there may be other movements between the shoulders and head.
Remember, the trend behind a head and shoulders pattern is bullish. So when identifying this pattern, pay attention to the process behind it.

What is the pattern of head and shoulders in technical analysis? + Trading method
Reverse head and shoulder pattern formation
- Left shoulder: lower the price, create a valley and then increase the price
- Head: Reduce prices to create lower valleys
- Right shoulder: increase and then decrease in price and form the right valley
- Reverse head and shoulder formation is also rarely seen completely, and other movements may be seen between the shoulders and head.
Remember the trend behind a reverse reverse head and shoulder pattern. So when identifying this pattern, pay attention to the process behind it.

Draw a neckline
The neckline is the level of support or resistance that traders use to set appropriate and strategic limits for ordering. In fact, in the head and shoulders, when the right shoulder reaches below the neckline, it means that the support is broken and the price falls further. In the reverse head and shoulder, the trend is reversed, and when the right shoulder reaches the top of the neckline, it means resistance failure and the continuation of the jump.

To draw a neckline, the first step is to mark the left shoulder, head, and right shoulder on the chart. In the head and shoulder pattern, we connect the price floor after the left shoulder as well as the price floor after the head pattern to draw a “neckline”; This line is shown in the diagrams above with a blue line.
What is the pattern of head and shoulders in technical analysis? + Trading method
Also, in the inverted head and shoulder pattern, we connect the price peak after the left shoulder to the price peak after the head and thus draw the neckline of this pattern.
After the head and shoulders are completed, the price usually falls by the distance from the head to the neckline. Also, after completing the reverse head and shoulder pattern, the price usually increases by the distance from the head to the neckline.

In the next section, we will explain the importance and application of the neckline.
How to deal with head and shoulders
To use this template, we must wait until the template is complete, because the template may not be complete at all or the template that is part of it may not be completed in the future. Patterns that are partially or half-completed should be monitored. However, no trades should be made based on it until the pattern intersects the neckline.
After looking at the head and shoulders on the chart, we have to wait for the price trend to go below the neckline after reaching the top of the right shoulder. In the case of the reverse head and shoulders, we have to wait for the formation of the right shoulder as well as price movements above the neckline.
Once you have completed the template, you can start trading. Plan your transaction in advance and write down your entry points, loss limit and profit target. Also, consider any other variables that may change your profit margin or profit target.
The most common entry point is formed at the intersection of the neckline and the trend. The other point of entry into the trade requires more patience and it is possible that the movement will be completely lost. In this case, after cutting the neckline, the trader has to wait for the pullback and the return process to the neckline. This method is a little more conservative and cautious, because we can observe the movement of the trend whether it abandons the partial correction path and re-takes the direction of the initial failure. If the price continues to move in the direction of failure, the opportunity to trade may be lost altogether. Both methods of entering the transaction are shown in the chart below.
Determining the limit of losses
In the head and shoulder pattern, the loss limit is just above the right shoulder. Also, the pattern head limit can be used as a loss limit, but this level will carry more risk and reduce the profit-loss ratio of the pattern.
In the reverse head and shoulder pattern, the extent of the damage can be determined just below the right shoulder. In this template, we can also set the loss limit on the template head. However, this also puts the trader at greater risk. In the chart above, the loss limit is set at $ 104 (just below the right shoulder).
Set a profit target
After completing the head and shoulder pattern or the reverse head and shoulder pattern, the price decreases or increases according to the distance between the head and the neckline.
In fact, the goal or profit margin for this pattern is the price difference between the head and the lowest level (floor) on each shoulder. This price difference is reduced from the neck line to achieve a downside profit target. For the reverse head and shoulder pattern, this price difference is added to the neckline to determine the price target and the profit point on the uptrend.
For example, as shown in the image above, the profit target for the reverse head and shoulder is calculated as follows:
$ 3 سر (head or the maximum price limit) $ 17 ₋ (lowest price limit after the right shoulder) $ 14
The difference between the two prices is added to the neckline (deducted in the normal head and shoulder pattern). If we add 14 to 3, we get 17, so we have to set our order to 11 to get out of the market with full profit.
Sometimes, investors have to wait a long time (up to several months) to reach their ideal profit target once the neckline has been identified. Continuous and timely monitoring of the trading process can help you predict their results. Professional traders also advise novices to be a little more cautious and to lower their profits than expected, as patterns are sometimes completed with little difference.
Reasons for efficiency in the transaction
No pattern is perfect, and no pattern is always effective. However, there are several reasons why the head and shoulder pattern works, at least on paper. In this section, we will point out some interesting features of the head and shoulder pattern, but this explanation applies to both types of head and shoulders:
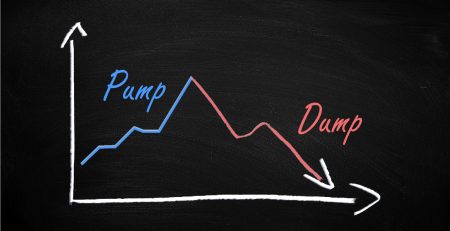
- When the price reaches the market ceiling (head), sellers enter the market and the buying pressure decreases.
- As you get closer to the neckline, many people who have bought in the last wave, at a higher price or in the process of rising prices on the right shoulder, will suffer huge losses. In fact, many people get out of their position at this stage and push the price towards the profit target.
- Determining the upper limit of the right shoulder is logical because the trend has shifted downwards, and the right shoulder is actually a peak with a lower height than the head. Therefore, the right shoulder will not be broken until the trend reverses upward.
- The profit margin is determined by the assumption that many traders who have made a mistake or bought the property at the wrong time will be out of position. Thus, a breeding process of equal size to the previous growth rate occurs.
- The neckline is the surface on which many traders lose and get out of their positions; Therefore, they drive the trend towards the price target.
- The volume of transactions can also be considered. During reverse head and shoulder patterns, it is best to increase trading volume after the neckline. This indicates an increase in buying interest, which can push the price towards the target. A decrease in the volume of purchases indicates the reluctance of traders to move upwards and can indicate the pessimism of investors.
Problems trading with this model
As mentioned earlier, this model also has its drawbacks. Some of the potential problems with head-to-shoulder trading include:
- You need to identify the patterns and follow the process of forming them. However, you should not use this strategy until the template is completed. This can be time consuming and time consuming.
- The head and shoulder pattern does not always work. Sometimes the trend comes into contact with the loss and the trade is lost.
- What is the pattern of head and shoulders in technical analysis? + Trading method
- The goal of profit is not always achieved. Therefore, it is better for traders to carefully adjust the variables that affect their exit from the market.
- This pattern does not always pave the way for trading. For example, if a significant drop occurs during the formation of one of the shoulders due to an unforeseen accident, the calculated price target may not be met.
- Patterns are often mentally implemented on the chart. A trader may see a shoulder of the pattern and another trader may not recognize it. Before entering into pattern-based trading, look at the general description above to define what your preferred terms and pattern should be.
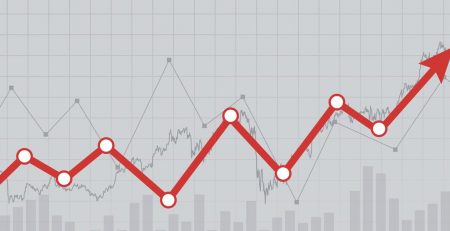
Concluding remarks
Head and shoulders occur at all intervals and are visually visible. Although this pattern is sometimes implemented mentally, its full form can identify entry points, loss limits, and profit targets to make it easier to execute a trading strategy. The head and shoulder pattern consists of the left shoulder, head, and then the right shoulder, respectively. The most common entry point is the intersection of the price trend with the neckline of the pattern.
In this case, the loss limit is higher (in the head and shoulders) or lower (in the reverse head and shoulders) than the right shoulder. The purpose and profit margin are also obtained from the difference between the ceiling and the floor with the pattern of addition (in reverse head and shoulder) or deduction (in head and shoulder) from the neckline. This system is not perfect, but it does provide a way for markets to trade based on reasonable price movements.
What is the pattern of head and shoulders in technical analysis? + Trading method


Leave a Reply