Triangle pattern in technical analysis
Triangle pattern in technical analysis : The triangle pattern is one of the most popular and reliable patterns in technical analysis. Because in this pattern, the next movement of the chart is more intense than other patterns. In technical analysis, triangular patterns are part of the patterns that continue the trend. While the shape of the triangle in the chart is very important, it is more important to move the price after leaving the pattern.
What is a triangle pattern?
The triangular pattern helps us to identify the continuation of an uptrend or downtrend. Usually in a triangle pattern, the price stabilization period consists of higher floors and lower ceilings during which a support line and a resistance line converge to form a triangle in the chart.

Triangular patterns are a perfect part of technical analysis. Successful traders, however, combine this pattern with other tools and technical indicators to maximize their chances of success.
Price target and loss limit in the triangle pattern
Entry price: Exactly after the upper trend line is broken, we enter the buy transaction and after the lower trend line is broken, we enter the sell position.
Exit price: The height of the triangle, which is the widest part of the triangle.
Loss limit: The loss limit is located exactly outside the pattern and opposite the direction in which the pattern is broken. For example, if you enter a buy trade after the price has crossed the top of the triangle, you set your loss limit exactly below the bottom line of the triangle. Also, if you open a sell position after breaking the bottom trend line of the triangle, the loss limit will be exactly above the top trend line of the triangle.
Always in the triangle pattern, the reward-to-risk ratio is much better than 1: 1. Because the loss limit is determined based on the narrowest part of the triangle and the profit limit is determined according to the widest part of the triangle.
The general shape of the triangle pattern
A triangle is formed when the price fluctuation is constantly smaller during several moves. If trend lines are drawn through precious floors and ceilings, the two lines will converge and form a triangle.
The top line of the triangle is the supply line and shows the saturation range of the market. This is where investors identify their profits. Also, the bottom line of the triangle is the demand line, and every time the price reaches it, the market is in saturation.
Because continuous triangles occur more often than return triangles, in an uptrend the focus is on the price crossing the top of the triangle and in a downtrend, the expectation is on breaking the bottom of the triangle.
Types of triangles
There are generally three different types of triangular patterns, each of which must be carefully considered. But they all show price stabilization and density. However, in order to trade, they are all similar to each other and only their appearance is different. In the following, we will examine the details of each.
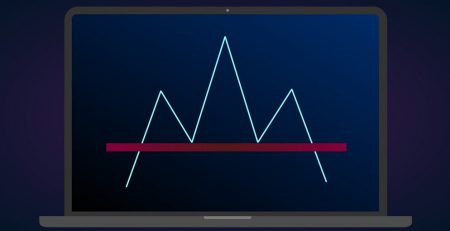
Ascending triangle pattern
Ascending triangles are incremental patterns in which the price exits above the triangle.
An ascending triangle occurs when the slope of the lower trend line is upward while the upward trend line is horizontal.
The horizontal trend line acts as a resistance and the uptrend line acts as a support.

The main interpretation of the pattern is that sellers try to lower the price in each fluctuation, but their success decreases each time and a higher floor is created in the chart.
The price is rising and the triangle pattern is increasing as a consolidation and continuation of the trend.

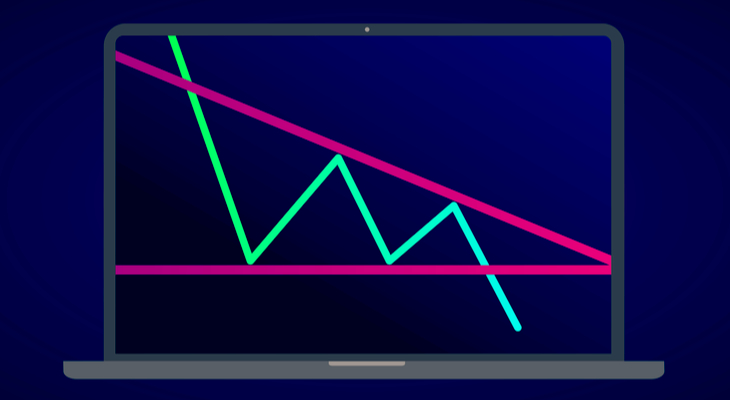
Decreasing triangle pattern
Descending triangles are descending patterns in which the price exits the bottom of the triangle.
A descending triangle occurs when the upper trend line has a downward slope. While the bottom trend line is horizontal.

The horizontal trend line acts as the support line and the bearish trend line acts as the resistance.
The pattern of a descending triangle is the opposite of an ascending triangle.

Symmetrical triangle pattern
- The symmetrical triangle pattern is usually formed during a process as a continuous pattern. This pattern includes at least two lower peaks and two higher floors.
- In a symmetrical triangle pattern, the price may come out on both sides of the triangle. When the price moves towards the narrow triangle, there is a possibility of leaving each side of the pattern.
- This pattern is formed when both the top and bottom trend lines of the triangle converge.
- Symmetrical triangles show the density period in which the downtrend line is the resistance line and the uptrend line is the support line.
- Symmetrical triangle patterns are formed in both small timeframes and larger timeframes. So if you are trading with this template, check the large time frames as well.

- If the failure in the symmetrical triangle is accompanied by candlestick patterns, it will be more valid.
- The closer the price is to the tip of the triangle (two-line convergence), the greater the probability of failure. The pattern is complete when the price exits the triangle. Conservative traders may be looking for indicators and other tools to confirm failure.

- The other trader may wait two days after the pattern breaks from the bottom or the top to enter a strong trend and be safe from the false break of the trend line.
- Finally, after the price breaks the high resistance of the triangle and the uptrend continues, buyers can lower their losses below the downtrend line.
Trading volume in a triangle pattern
When you trade with this template, trading volume can give you a better understanding. Trading volume plays a key role in confirming the failure of a triangle pattern.
If the volume is not associated with pattern failure, the signal is not sufficiently reliable. Wrong or fake failures have been associated with a lack of trading volume. Therefore, in case of failure, observing the volume, price actions and indicators protects the trader from wrong failures.
Conclusion
- Triangle patterns are a common tool of technical analysis and are mainly used by traders who trade based on breaking trend lines.
- Symmetrical triangle patterns consist of a support uptrend line and a downtrend resistance line.
- One of the important criteria of triangles is the presence of at least four price reflection points inside the triangle.
- The transaction based on the triangle pattern must be made after the pattern is broken.
- The triangle pattern is also called the two-sided pattern. This is because pattern failure can continue the previous direction of the chart or cause the chart to return. But almost every 10 failures, 9 failures are in the direction of the previous trend chart and continue the current trend.
Leave a Reply