How to draw a trend line?
Using trend lines is one of the most widely used methods of identifying support and resistance points in the chart. But the correct way to draw the trend line is still questionable for many traders. In this article, we will go to the nature of trend lines and how to draw them, so that after studying it, you can identify the best floors and ceilings of the chart and experience profitable trades.
How to draw a trend line
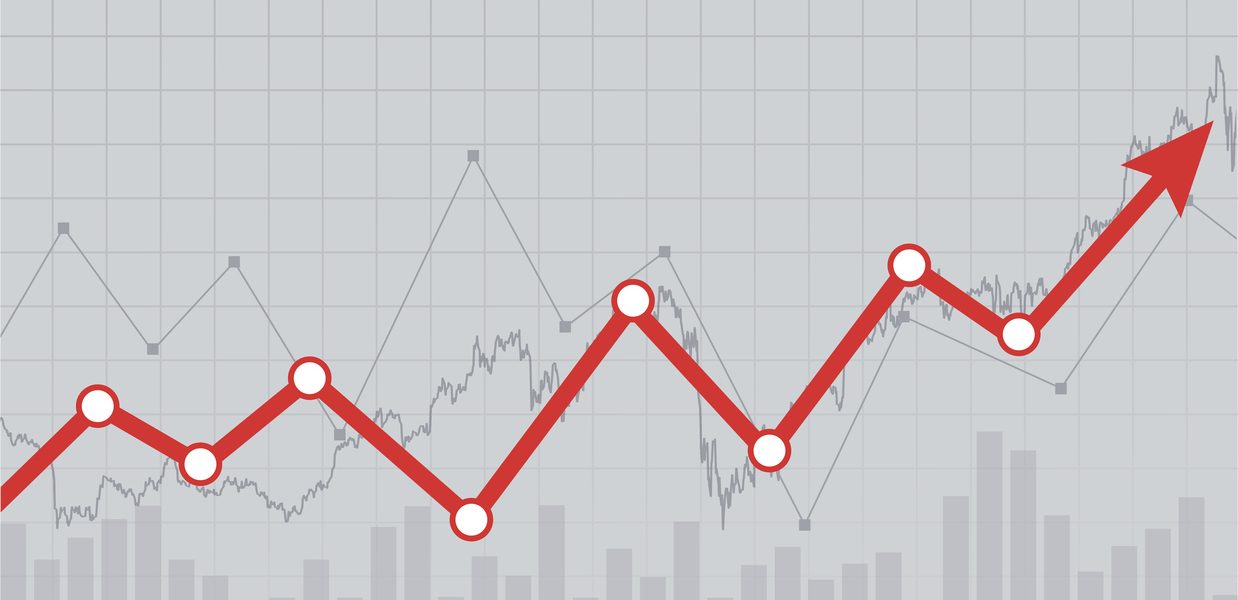
The trend line is a dynamic graphing tool. This line consists of connecting the price rotation points in the chart. In technical analysis, the trend line is used to identify possible points of market reaction. These lines can be supportive or resistance based on market conditions and charts. In fact, the trend line, support or resistance is horizontally diagonal. This approach is vital for traders as it helps them identify important supply and demand points that can change the direction of the market and shape new trends. See the image below:

In this image, the trend line has an ascending nature and has a supporting role. As shown in the picture, traders had at least one safe buy opportunity during the uptrend along this line. In the chart below, there are other conditions.

The trend line in the above chart is descending and has a resistance property. The difference between the two charts is that the first mode provides traders with a buy trading position and the second mode in one-way markets provides an opportunity to exit the share in price ceilings and in two-way markets provides a trading trading position.
How to draw the trend line correctly?
So far in this article, we have tried to give a proper definition of the basic concepts and application of trend lines. In this step, we will learn how to draw them correctly. The most basic concept about drawing this line is to have at least two points to draw a trend line. In other words, the trend line consists of connecting at least two floors or price ceilings in the chart. Pay close attention to the following example.

The last price candle shown in the square, covering the previous neutral price candles exactly on the uptrend line, is promising for two groups of traders. The first group are those who bought the stock at low prices and after a period of downward correction, were hesitant to continue the climb, which usually keep their shares after this happens. The second category is traders who have been waiting for a good and low-risk opportunity to enter the stock to join the new uptrend. Most of these people enter the buying position after closing the price candle of the chart and making sure of the bullish strength of the market.
Important points about the time period of the chart
Trend lines drawn in higher time periods are usually more powerful. For this reason, it is best to always start your analysis with long-term charts, such as the weekly chart, and reduce the chart periodically. Always find the trend line that has the highest number of collisions and has not passed through the body of the price candle. Always avoid drawing a trend line that has passed through the body of the precious candle.
Because such cases will have no analytical value. Many traders believe that the daily chart is the best possible time period to analyze market trends. Because its temporal nature is not purely long-term or short-term, it is possible to observe and analyze a reasonable period of time along with its important details. Also, the time spent between the initial points of the trend line formation – at least two points – is important, and the longer the market reacts to it, the more important it will undoubtedly become.
There is a very important point about the time period of the chart; It is better for traders to use multi-time analysis technique to increase the credibility of analytics and less risky trades. For example, to trade based on an uptrend line in the weekly chart, it is better to trade in corrective situations or based on overlapping trend lines in the daily chart.
Precious candles and trend lines
One of the most important questions for traders when drawing is which area of the candlesticks they should draw the trend line for based on which area – the opening and closing price or the maximum and minimum! The answer to this question depends on the terms of the chart and the analyst’s point of view.
general, a trend line that perfectly matches the ups and downs or opening and closing of price candles is formed in rare cases.
In simpler terms, there is no specific and established rule in this field and each person can use them according to their personal views and experiences.
this regard, traders only need to focus on the intersection of the line and the body of the precious candles.
Deal with the trend line set!
This is probably the biggest problem people have when drawing trend lines, which is called “forced curve adjustment”. This condition occurs when a person, out of prejudice against the conditions of the chart, believes in an area correctly and begins to draw and adjust the lines based on misconceptions. The most important thing in drawing lines and levels of support and resistance is that the best points of return on the chart are always the clearest. So if a trend line does not conform well enough to the rules of graph analysis, it is best to go for another tool or pattern or hold on to the right position.
How to trade using trend lines?
In general, there are two main methods for trading based on this technical analysis tool. The first case is when the price has gone through a certain trend and these lines have an absolute support or resistance role, in which traders enter the buying position when the price touches the support trend line by the price, according to the current market trend. Conversely, it is used as an opportunity to exit one-sided markets.
Another situation is when they are broken by price candles and the price is closed higher or lower than them, in which case the trend line becomes inverted and becomes the so-called levels of occurrence. For example, a bearish trend line that acts as a resistance becomes a support line after a break, and most traders wait for the price to return to the trend line, where they enter a low-risk trade. In this regard, pay attention to the chart below.
In short, you should always look for a trend line that has at least 2 to 3 collisions and has not passed through the body of the price candle. In other words, the more ideal the trend line, the more credibility and, consequently, the higher your trading returns. This trading method is undoubtedly one of the best ways to capture large market movements with the least possible risk. We hope you find this article useful.


Leave a Reply