What is time frame in technical analysis?
What is time frame in technical analysis? If you are in the financial markets or you are interested in discussing the analysis of these markets

What is time frame in technical analysis? If you are in the financial markets or you are interested in discussing the analysis of these markets
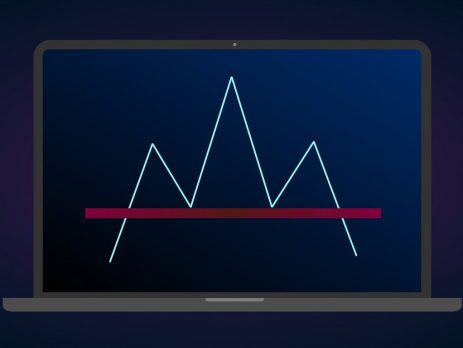
What is the pattern of head and shoulders in technical analysis? + Trading method, head and shoulders; A popular pattern in technical analysis is that when seen on the chart we should be prepared for a price drop and a terrible downtrend. In this article, you will first get...

Weekly Technical Analysis of Cryptocurrencies February 16: Technical Analysis of Bitcoin, Ethereum, Ripple, Bitcoin Cash, Light Coin, Cardano, Binance Coin, Polkadot and China Link prices for today:
Technical analysis of Bitcoin, Ethereum, Ripple, Bitcoin Cash, Light Coin, Cardano, Binance Coin, Polkadot, Dodge Coin and China Link prices for today (February 10) is as follows
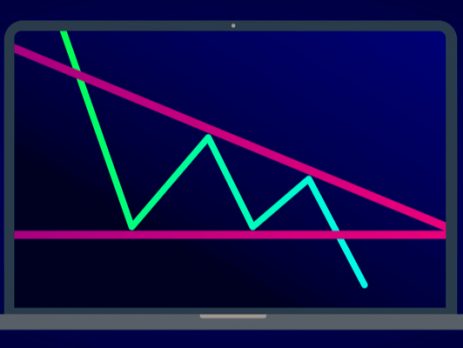
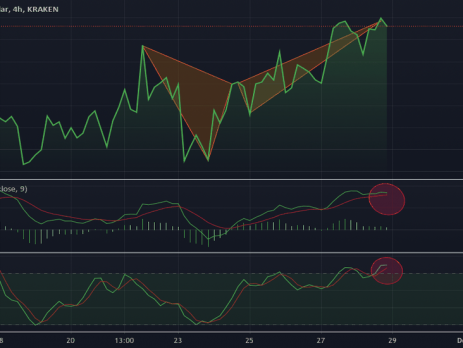
The triangle pattern is one of the most popular and reliable patterns in technical analysis
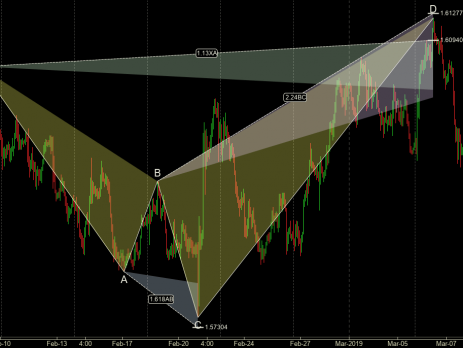
Another widely used harmonic pattern is the shark pattern. As you know, harmonic patterns in technical analysis are invented from a combination of Fibonacci numbers and geometric shapes. As a result
The bat pattern is one of the types of harmonic patterns in technical analysis that provides very good conditions for entering into a profitable transaction. This pattern can appear on the price chart in both ascending and descending bats.
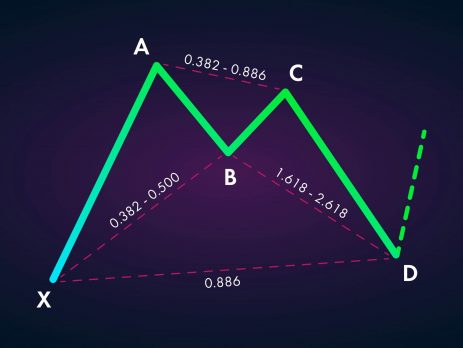
Harmonic trading is a type of technical analysis that is widely used in the Forex, futures and stock markets. Harmonic trades use certain price patterns that are created based on certain Fibonacci ratios.
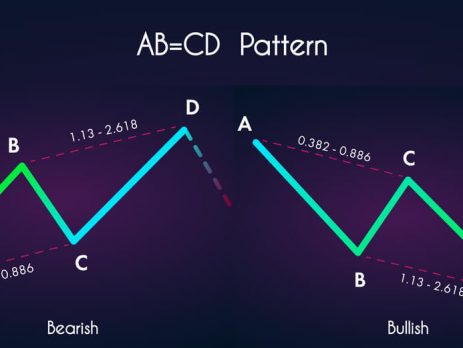
The ABCD pattern is one of the harmonic patterns used by technical analysts to predict prices. Some traders refer to the ABCD pattern as the AB = CD pattern.