
Weekly Technical Analysis of Cryptocurrency February 9
Weekly Technical Analysis of Digital Currencies February 9 : Technical analysis of Bitcoin, Ethereum, Ripple, Bitcoin Cash, Light Coin, Cardano, Binance Coin, Polkadot, Dodge Coin and China Link prices for today (February 10) is as follows:
Weekly technical analysis of bitcoin prices
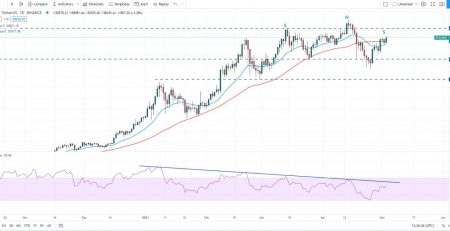
The price of Bitcoin yesterday, at the same time as announcing Tesla’s $ 1.5 billion investment in Bitcoin, climbed to its most recent historical high of $ 41,959.63 and today saw a $ 48,000 level in Binance Exchange. Is. The reason for these movements can be attributed to the strong institutional demand in the market that has pushed prices to new heights.

With the strong price climbing above the resistance of $ 4,959.63 yesterday, its growth path will be open to the psychological resistance of $ 50,000. There will be a strong defense of sellers from this level. But by breaking this resistance, the price is likely to rise to $ 60,974.43.
On the other hand, if the price moves quickly below its recent ceiling of $ 41,959.63 and fails to stabilize above this level for a few days, market bears will try to lower it below $ 38,000. . In this case, moving averages are likely to be seen again. A break below the 20-day moving average (EMA 20 – blue line in the picture) at $ 36,196 will be the first sign of a weakening uptrend and the fall below the 50-day simple moving average (SMA 50 – red line in the picture) ) At $ 33,250, warns of the possibility of a deep price correction.
Resistances: 50,000 – 60,974.43
Supports: 41,959.63 – 38,000 – 36,196 – 33,250
Weekly technical analysis of Ethereum prices
Ethereum traded lower at $ 1,757,338 on February 5, but buyers traded strong near the breakout level at $ 1,474,096. This can be seen from the tall candle in the candle on February 7 .
The upward slope of the moving averages and the placement of the relative strength index (RSI) in its positive area indicate the superiority of buyers in the market. Given the price stabilization above the level of $ 1,757,338, it can be said that the uptrend will resume. The next target price will be $ 1,870 and above it there is a possibility to move up to $ 2,000 resistance.
On the other hand, if the price moves above the current levels, there is a possibility of limited fluctuations for a few days in the consolidation phase between the limits of $ 1,473,096 to $ 1,757,338. Breaking the price below this range will push it down to the simple 50-day moving average (SMA 50 – red line in the picture) at $ 1,148.
Resistance: 1,757,338 – 1,870 – 2,000
Support: 1,473,096 – 1,148
Weekly Technical Analysis of Cardano Price
Momentum (acceleration) Cardano’s price has risen since leaving its uptrend channel on February 5, and market cows have easily pushed the price above the $ 0.60 resistance. This move will increase the probability of price growth to $ 0.80.

Although the uptrend of moving averages indicates buyers’ dominance in the market, the movement of the Relative Strength Index (RSI) in the buy saturation zone warns of a possible correction or entry of the price into the consolidation phase in the short term. Price consolidation indicates that traders are in no hurry to save on their trading profits. This will improve the outlook for the upward trend in prices.
On the other hand, the price correction may pull it down to the 20-day moving average (EMA 20 – blue line in the picture) at $ 0.454. A strong jump in prices from this level indicates that the uptrend is untouched and a fall below it warns of a weakening of the uptrend.
Resistances: 0.80
Supports: 0.454
Ripple Price Weekly Technical Analysis
The Ripple price has been stabilizing above the $ 0.3850 level for the past few days, but buyers are trying to push it above the $ 0.50 level. This indicates a lack of demand at higher price levels.
On February 7, the bear market tried to lower the price below $ 0.3855 but failed. These moves indicate that buyers are entering the market with falling prices. When sellers are manipulated by price recovery and buyers enter losses, prices will remain within a confined range.
Breakout and closing above the $ 0.50 resistance will continue the uptrend with the target of $ 0.65, while breaking the support of the 20-day moving average (EMA 20 – blue line in the picture) at 0.374 The dollar will push the price down to the simple 50-day moving average (SMA 50 – red line in the picture) at $ 0.312.
Resistances: 0.50 – 0.65
Supports: 0.3850 – 0.374 – 0.312
Weekly technical analysis of Polkadot prices
The failure of the bears to lower and stabilize the price of Polkadat below the level of $ 19.40, has attracted buyers and consequently led the price to new levels today.
The price target on the way up will be $ 24.08 and above it $ 30. The slope of both moving averages is upward and the relative strength index (RSI) is located near the buy saturation zone. The combination of these factors shows the superiority of buyers.
The uptrend will be eliminated by turning around the price movement and falling below the 20-day moving average (EMA 20 – blue line in the picture) at $ 17.91. Such a move would be able to lower the price until further support at $ 14.7259.
Resistances: 24.08 – 30
Supports: 19.40 – 17.91 – 14.7259
Weekly Technical Analysis of Binance Coin Price
The price of Binance Coin on February 5 has gone above the resistance of the upper side of the uptrend pattern. In the current situation, sellers will try to delay the uptrend to $ 95.
After a shallow price correction on February 7, buyers are looking to continue the uptrend. The first price target on the uptrend will be $ 95 and above it $ 100.
On the other hand, the daily high candle wick of the current day indicates that the profit of trades is saved by a group of traders. With the price falling below the 38.2% Fibonacci retracement level of the recent uptrend at $ 84.5, there is a possibility that the broken August level of $ 77.5 will be seen again. Below this level, there is a possibility that the price will move into the pattern again.
Resistances: 95-100
Supports: 84.5 – 77.5
Weekly technical analysis of Light Coin price
Over the past few days, the price of Light Coin has been hovering between the two lower limits of the 20-day moving average (EMA 20 – blue line in the picture) at $ 144.98 and the upper limit of $ 160. Buyers in the current situation have pushed the price above this range. In such a situation, the next target price will be $ 185,5821.
Above this level, there is a possibility of continuing the upward trend with a target of $ 200. On the other hand, if the price moves above the high resistance at $ 185.5821, it is likely to fall again to the 20-day moving average. The breakout price below the moving averages will be the first sign of a weakening and it is likely to fall to $ 120.
Resistances: 160 – 185.5821 – 200
Supports: 144.98 – 120
Dodge Coin Weekly Technical Analysis
Dodge Coin Pump The price of January 28 and 29 faced strong selling pressure at $ 0.0875. Due to the fact that the price fell on January 30, but the sellers have not been able to intensify the selling pressure. The heavy buying trend at lower levels has continued its upward trend on February 4. During these movements, the price has moved above the psychological resistance of $ 0.050 and has stabilized.
Although the price has moved down from the resistance of $ 0.0875, the long wick of the price candle on February 8 shows the accumulation of good buyers. If these people manage to push the price above the level of $ 0.0875, there is a possibility of a momentary increase in the price.
The next target price will be $ 0.102412 and above $ 0.13. Contrary to expectations, if the price moves down from $ 0.875, there is a possibility that the price will fluctuate for a few days in the consolidation phase and before the next directional movement.
Resistances: 0.0875 – 0.102412 – 0.13
Supports: 0.050
Weekly Technical Analysis of China Link Price
The high wick of China Link price on February 7 indicates the entry of buyers into the market with a drop in price to the 20-day moving average (EMA 20 – blue line in the picture) at $ 23.15. If these people manage to push the price above the resistance area of $ 25.7824 to $ 27, it will be possible to continue the uptrend.
The initial target price will be $ 30 and above $ 33. The upward slope of the moving averages and the placement of the Relative Strength Index (RSI) in its positive area indicate the superiority of buyers.
On the other hand, if the price moves down from this area, the sellers will try to lower the price below the 20-day moving average again. In such a situation, there is a possibility that the decline will continue up to $ 20.1111.
Resistances: 25.7824 – 27-30 – 33
Supports: 23.15 – 20.1111
Weekly technical analysis of bitcoin cash price
The price of Bitcoin Cash on February 6 has risen above the resistance of $ 465.02, but buyers have not been able to stabilize the breakout price. This has saved the trading profit and the price has gone below the 20-day moving average (EMA 20 – blue line in the picture) at $ 439 on February 7.
However, sellers have not been able to increase the selling pressure and push the price below the simple 50-day moving average (SMA 50 – red line in the picture) at 422. On the other hand, buyers have once again pushed the price above $ 465.02. This will likely increase the price to $ 515.
On the other hand, if the price moves above the current levels and moves below the simple 50-day moving average, we will receive a warning that the uptrend will be weakened.
Resistance: 515
Supports: 465.02 – 422
Weekly Technical Analysis of Digital Currencies February 9

Leave a Reply