
Cryptocurrency Weekly Technical Analysis March 9
Cryptocurrency Weekly Technical Analysis : Technical analysis of Bitcoin, Ethereum, Ripple, BitcoinCash, LightCoin, Cardano, BinanceCoin, Polkadot, Chainlink and Uniswap prices for today:
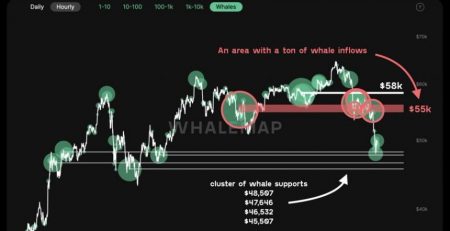
Weekly technical analysis of bitcoin prices
Bitcoin traded between the 20-day moving average (EMA 20 – blue line in the picture) at $ 48,701 and the resistance at $ 52,040 until the last trading day. The price with today’s candle above this range has broken out.

Although the 20-day moving average is horizontal, the Relative Strength Index (RSI) is gradually rising. This means that buyers are trying to increase their dominance in the market.
If the market bulls with the trading candle today manage to stabilize the price above 52,040, the bullish triangle pattern will be activated in the price chart. This will eventually push the price to a historic high of $ 58,341 and then to the target target of $ 61,075.
Cryptocurrency Weekly Technical Analysis March 9
On the other hand, if the price moves above the current levels and moves below the uptrend line, there is a possibility that short-term traders will save trading profits. In this case, there is a possibility that the price will fall to $ 46,313, and if this support is violated, it will be possible to continue the fall to $ 41,959.
- Resistances: 58,341 – 61,075
- Supports: 52,040 – 48,701 – 46,313 – 41,959
Weekly technical analysis of Ethereum prices
Ethereum traded above $ 1,670 on March 7, indicating strong uptrend. The 20-day moving average (EMA 20 – blue line in the picture) has moved upwards at $ 1,624 and the Relative Strength Index (RSI) has risen above 57. These factors warn of the relative superiority of buyers.
If the price stays above the moving average, it is likely to rise to its historic high of $ 2,040. A break (breakout) of the price above this resistance will be able to start the next bullish wave.
Cryptocurrency Weekly Technical Analysis March 9
On the other hand, if the price moves down from the current levels and falls below the simple 50-day moving average (SMA 50 – red line in the picture) at $ 1,572, the key support of $ 1,289 is likely to be seen again. .
- Resistance: 2,000 – 2,040
- Support: 1,670 – 1,624 – 1,572 – 1,289
Weekly Technical Analysis of BinanceCoin Price
BinanceCoin has jumped above the 20-day moving average (EMA 20 – blue line in the picture) at $ 217, but the cows have failed to push the price above the high resistance at $ 265. This indicates a lack of demand at higher price levels.
If market bears manage to lower the price below the support of the 20-day moving average, the price can be pulled down to $ 189. Failure of the price under this support will open the way to a simple 50-day moving average (SMA 50 – red line in the picture) at $ 137.
Cryptocurrency Weekly Technical Analysis March 9
On the other hand, if the price jumps above the 20-day moving average, buyers will try to push it above the $ 265 level. If successful, price increases of up to $ 309.49 are possible. The upward and gradual slope of the 20-day moving average and the relative strength index (RSI) above the level of 57, indicate the relative superiority of cows in the market.
- Resistances: 265 – 309.4995
- Supports: 217-189-137
Weekly Technical Analysis of Cardano Price
The price of Cardano has remained above the 20-day moving average (EMA 20 – blue line in the picture) at $ 1.08 over the past four days, but buyers have not been successful in throwing the price, which indicates a lack of demand at current levels.
Sellers may now try to lower the price below the support of the 20-day moving average and correct the price to $ 0.9817712 and below it to the 50-day moving average (SMA 50 – red line in the picture) at 0.769. Deep dollars.
However, the horizontal slope of the 20-day moving average and the relative strength index (RSI) above the level of 58 indicate the relative superiority of market buyers. If the price jumps from the current levels and goes above the level of $ 1.20, it is able to grow to $ 1.35 and above it to $ 1.48.
- Resistances: 1.20 – 1.35 – 1.48
- Supports: 1.08 – 0.9817712 – 0.769
Weekly technical analysis of Polkadot prices
The current price of Polkadot is being traded within a symmetrical triangle pattern. This pattern is often referred to as a continuous pattern, but sometimes, in certain market conditions, it plays the role of a recurring pattern and warns of changing price trends.
If market bears push prices below the bottom of the pattern, sales pressure will increase as short-term sellers arrive. In this case, the price is likely to fall to $ 26.50 and up to the target of the model at $ 17.
On the other hand, if the price jumps from the current levels and moves above the triangle, the price is likely to rise to a historic high of $ 42.28. If this level is seen, it is likely that the price will continue to grow to the target of the model at $ 52.50.
- Resistances: 42.28 – 52.50
- Supports: 26.50 – 17
Ripple Price Weekly Technical Analysis
The Ripple price has formed a short-term bullish triangle pattern that will be activated after the breakout and stabilization of the price above the $ 0.50 level, and its target will be at the $ 0.635 level.
On the other hand, if the price moves above the current levels and moves below the lower side of the pattern, the price is likely to fall to $ 0.359. Breakout and stabilization below this level will activate the Soroshaneh pattern with a target of $ 0.173.
Cryptocurrency Weekly Technical Analysis March 9
The horizontal slope of the 20-day moving average and the relative strength index (RSI) above the level of 50, shows the balance between supply and demand in the market. Therefore, there is no obvious advantage for either group, and it is better to wait for a breakout price from one of the mentioned levels before entering the trades.
- Resistances: 0.50 – 0.635
- Supports: 0.359 – 0.173
Weekly technical analysis of Uniswap prices
The price of Uniswap set a new historical price target on March 7, but buyers have not been able to ride on this powerful uptrend. In the current situation, market bears are trying to bring the price back below the $ 33 resistance, which has now become support.
If successful, the price could be adjusted to the $ 30 level and below that to the 20-day moving average (EMA 20 – blue line in the picture) at $ 26.23. The strong jump in prices from each of these support levels indicates that buyers are entering the market with each fall and efforts are continuing to continue the uptrend.
A break above the $ 35 level could raise it to $ 46. The uptrend of moving averages and the placement of the Relative Strength Index (RSI) in the buy saturation zone indicate that the uptrend is intact.
The uptrend will be eliminated by turning the price and falling below the 20-day moving average, which will have the ability to lower the price to the simple 50-day moving average (SMA 50 – red line in the picture) at $ 20.31.
- Resistance: 46
- Supports: 33 – 30 – 26.23 – 20.31
Chainlink Weekly Technical Price Analysis
Chainlink is currently priced at $ 24 to $ 32. On March 7, buyers moved the price above the 20-day moving average (EMA 20 – blue line in the picture) at $ 28.46. The move paved the way for the price to rise to a high resistance at $ 32.
If the price moves below the $ 32 support and stabilizes, the bullish triangle pattern will be activated in the price chart with the target of $ 43,191. Given that the 20-day moving average is horizontal and the Relative Strength Index (RSI) is in its positive territory, it can be said that the advantage is with buyers.
However, if the price moves rapidly from the $ 32 level down and breaks the lower side of the price, the transverse fluctuations will continue. With the price turning and breaking below the $ 24 support, the trend will turn in favor of the sellers. Such a move would be able to lower the price to the level of $ 20,111.
- Resistances: 32 – 43.191
- Supports: 28.46 – 24 – 20.1111
Weekly Technical Analysis of Litecoin Prices
The price of Litecoin is in the resistance range of $ 185.58 to $ 196.30. The price has moved down from this area yesterday and has moved below the lower limit of this range. This indicates the flow of trading profits at higher price levels.
Market bears in the current situation will try to lower the price to the simple 50-day moving average (SMA 50 – red line in the picture) at $ 171.94 and below it to the uptrend line. A break below this support will be able to deepen the correction up to $ 152 and below $ 120.
However, the moving average is horizontal and the Relative Strength Index (RSI) is near its mid-level. These factors will indicate the price fluctuations for a few more days.
If the price moves higher than the current level and goes above the level of $ 196.30, the trend will be in favor of market buyers. Under such circumstances, the price is likely to rise to $ 246.96. A break (breakout) of the price above this resistance will also be a warning that the uptrend will continue.
- Resistances: 185.58 – 196.30 – 246.96
- Supports: 171.94 – 152-120
Weekly technical analysis of Bitcoin cash prices
Bitcoin cash is currently trading at $ 539 between the uptrend line support and the uptrend. The price yesterday formed a Dodge Kendall pattern that shows a lack of certainty between buyers and sellers.
However, the upward and gradual slope of the 20-day moving average at $ 531 and the relative strength index (RSI) below the 48 level indicate the relative superiority of sellers. If traders push the price below the uptrend line, the price is likely to continue to fall to $ 440 and below $ 370 below.
On the other hand, if the bulls of the market move the price above the level of $ 539 and stabilize, the price growth is possible up to $ 631.71.
- Resistances: 531 – 539 – 631.71
- Supports: 440-370


Leave a Reply