
Weekly technical analysis of cryptocurrencies April 13
Weekly technical analysis ; Technical price analysis of Bitcoin, Ethereum, BinanceCoin, Cardano, Polkadot, Ripple, Uniswap, Stellar, LightCoin and Chainlink Read the for today:
Weekly technical analysis of bitcoin price
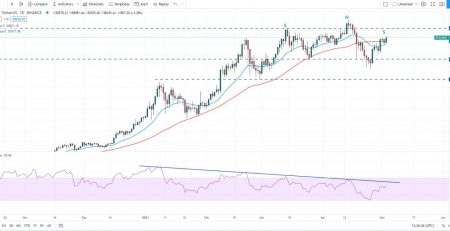
The price of Bitcoin on April 11 formed a candlestick pattern of Inside Bar, which indicates a lack of uncertainty between the two market groups. Buyers have tried to push the price above the all-time high of $ 61,825.84 yesterday to end the fluctuations in their favor, but market bears have taken a different view and have once again successfully defended the resistance.

Although sellers are trying to defend this resistance, they have not been able to move the price from this level to lower levels. This indicates that buyers are not in a hurry to exit their open positions in the market, because they hope for continued price growth.
The bulls of the market today have managed to push the price above the resistance of $ 61,825.84, by stabilizing the price above this level, the reverse head and shoulder pattern will be activated according to the figure. The target for this pattern is at $ 69,540, and if the uptrend is maintained, the next target to be looked at will be $ 79,566.
This uptrend will be eliminated by turning the price and moving below the simple 50-day moving average (SMA 50 – red line in the image) at $ 54,7823. Such a move warns of a deeper price correction.
- Resistances: 69,540 – 79,566
- Supports: 54,7823
Weekly technical analysis of Ethereum price
The price of Ethereum has been trading above $ 2,040.77 above the broken level for the past few days, but there is a lack of momentum in the chart. The candle wick on April 10 and the candle insider pattern on April 11 warn of market cows hesitating to push prices higher.

If the bullish momentum does not rise in the next few days, sellers will start another attempt to lower the price below $ 2,040.77. With the price falling below the 20-day moving average (EMA 20 – blue line in the picture) at $ 1,985, the next target price will be the uptrend line (blue line). Failure of the price below this level also warns of a deeper price correction.
However, the uptrend of the 20-day moving average and the relative strength index (RSI) above the level of 60 show the superiority of market cows. If the pair raises the price above $ 2,200, it is likely that the next bullish wave will start at $ 2,618.14.
- Resistance: 2,200 – 2,618.14
- Support: 2,040.77 – 1,985
Weekly Technical Analysis of BinanceCoin Price
The price of BinanceCoin is in a strong uptrend, but fluctuations in this trend over the past three days are signs of weakness. Yesterday’s high price candle wick also shows the profit reserve in the hands of traders at higher levels.

Although the 20-day moving average (EMA 20 – blue line in the picture) is moving upwards, the relative strength index (RSI) above the level of 80 indicates that the uptrend has expanded too much in the short term. Or in the term extended. This could lead to a slight correction in the price or its entry into the consolidation phase in the next few days. In a strong uptrend, the correction usually does not take more than one to three days.
The first price support on the downtrend is the 38.2% Fibonacci retracement level at $ 483.95. With the price jumping from this support, it can be said that the market sentiment remains positive and buyers enter the market in the fall. The group will eventually try to continue the uptrend and raise the price to the level of $ 638.56.
If successful, the next wave of price action is likely to start with a target of $ 888.70. On the other hand, if sellers lower the price below $ 483.95, there will be a continuation of the decline to the 20-day moving average at $ 385.
- Resistances: 638.56 – 888.70
- Supports: 483.95 – 385
Weekly Technical Analysis of Ripple Price
The contraction of Ripple price fluctuations on April 9 has continued the upward trend on April 10, which has pushed the price above $ 1.11. Buyers have strongly defended the fluctuations, eventually pushing the price above the $ 1.50 key and key resistance.
The sellers have not been able to consolidate their superiority and start price correction in the last two days, but they have pushed the price front to the above resistance and breakout has stabilized above this level. Price pullback to this level may be done quickly and quickly.
With Kendall stabilizing today above the $ 1.5 resistance, it is likely to rise to $ 2. At the same time, with the price falling and falling below $ 1.30, the price correction will begin.
The key price support is on the downside of $ 1.11; If buyers prevent the price from falling at this level, they will try again to push it above the $ 1.5 resistance. Any break below $ 1.11 will result in a fall to the 20-day moving average at $ 0.89.
- Resistances: 2
- Supports: 1.50 – 1.11 – 0.89
Weekly Technical Analysis of Cardano Price
The bulls of the market have successfully kept the price of Cardano above the simple 50-day moving average over the past few days (SMA 50 – red line in the picture) at $ 1.17 and are currently trying to start a new uptrend. However, the long wick of the price candle yesterday shows a decrease in buying pressure above $ 1.33.
If the price fails to stabilize above this level, sellers will resume their efforts to lower the price below the simple 50-day moving average. In this case, there is a possibility of further decline to the support area of $ 0.98 to $ 1.03.
A jump in prices in this area could keep volatility limited for a few more days. In return for breaking this support area, it will be possible to continue the fall to $ 0.80.
This bearish view will be eliminated by stabilizing the price above the level of $ 1.33, which can lead it to $ 1.5 again. A break above this resistance will start the next bullish wave up to $ 2.
- Resistances: 1.33 – 1.5 – 2
- Supports: 1.17 – 1.03 – 0.98
Weekly technical analysis of Polkadot price
Over the past few days, the price of Polkadot has been capped between the 20-day moving average (EMA 20 – blue line in the picture) at $ 39.30 and the upward resistance at $ 42.28. However, price fluctuations in this range are unlikely to last long.
If buyers manage to push the price above the resistance, it is likely to grow to $ 46.80. Sellers will defend this level again, but if this resistance is broken, the next targets will be $ 53.50 and above $ 57.
The upward and gradual slope of the 20-day moving average and the relative strength index (RSI) above its mid-range indicate the relative superiority of buyers. As the price moves below the moving averages, the downtrend will open up to $ 32.50 and below it up to $ 26.50.
- Resistances: 42.28 – 46.80 – 53.50 – 57
- Supports: 39.30 – 32.50 – 26.50
Weekly technical analysis of Uniswap price
The price of Uniswap climbed to its historic high of $ 36.80 yesterday. Although moving averages have not yet moved higher, the Relative Strength Index (RSI) has moved closer to the buy saturation zone, indicating an upward momentum in the price.
A stabilization above $ 35.20 indicates heavy demand at higher price levels. Under such circumstances, the price is likely to rise to $ 43.43. Violating this level, the next target of the uptrend will be $ 50.
On the other hand, if buyers fail to stabilize the price above $ 35.20, it can be said that at higher levels, the trading reserve is stable. With prices falling and stabilizing below $ 35.20, volatility within the range is likely to continue.
- Resistances: 43.43 – 50
- Supports: 35.20 – 25.5
Weekly technical analysis of LightCoin price
The contraction of LightCoin price fluctuations on April 8 and 9 has led to an upward wave. Buyers moved the price above $ 246.96 during the next trading day and have kept it above that level since that date.
The uptrend of the 20-day moving average and the relative strength index (RSI) above the level of 60, indicate that the price is on the uptrend. If buyers raise the price above $ 262.93, it will be possible to continue growing to the target of $ 307.42.
This upside view of breakout and price stabilization below $ 246.96 will be eliminated. Such a move indicates the flow of trading profits at higher price levels. The key support to be seen on the downtrend will be the 20-day moving average (EMA 20 – blue line in the picture) at $ 218.
The strong jump in prices from this moving average indicates positive market sentiment and it can be said that buyers will try to continue the upward trend in prices. On the other hand, a break below the 20-day moving average at $ 218 will push the price down to $ 170.
- Resistances: 262.93 – 307.42
- Supports: 246.96 – 218-170
Chainlink Weekly Technical Price Analysis
Chainlink is priced between $ 24 and $ 36.93. The gradual upward slope of the 20-day moving average (EMA 20 – blue line in the picture) and the relative strength of the index above its mid-level, indicate the relative superiority of buyers in the market. However, the failure of buyers to challenge the resistance of $ 36.93 indicates a decline in demand at high price levels.
Market bears are currently trying to bring prices below $ 32 support. Success in doing so will increase the likelihood of breakout below moving averages. Such a move would be able to bring the price down to the $ 24 level.
Contrary to expectations, if the price jumps above the 20-day moving average, buyers will once again try to push the price above the $ 36.93 level. If successful, it will be possible to continue the uptrend with a target of $ 40 and above $ 50.
- Resistances: 36.93 – 40 – 50
- Supports: 32-24
Weekly technical analysis of Stellar price
Buyers are trying to keep up with the stellar price, but strong resistance at $ 0.60 has put them in the way. Buyers pushed the price above this resistance on April 11, but failed to stabilize it.
If the market cows do not manage to push the price below the level of $ 0.55, it can be said that the accumulation trend in the losses continues. The upward slope of the 20-day moving average and the relative strength index (RSI) near the buy saturation zone show the superiority of buyers.
Breakout and price stabilization above the level of $ 0.60 will be the first sign of buyers’ dominance over sellers. Under these conditions, there is a possibility of continuing the upward trend of the price with a target of $ 0.72 and above it up to $ 0.85.
On the other hand, with the price falling below the level of $ 0.55, there is a possibility that the price will fall to the 20-day moving average at $ 0.47.
- Resistances: 0.60 – 0.72 – 0.85
- Supports: 0.55 – 0.47


Leave a Reply