
Weekly Technical Analysis of cryptocurrencies May 18
Read the technical analysis of Bitcoin, Ethereum, Binance Coin, Cardano, Dodge Coin, Ripple, Polkadot, Bitcoin Cash, Light Coin and Uniswap for today:
Weekly technical analysis of bitcoin prices
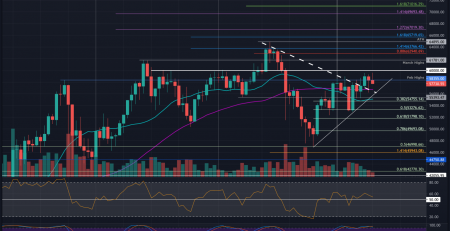
The price of Bitcoin in the 100% Fibonacci, which is at the level of $ 60,959, is facing strong resistance. Although buyers have already managed to overcome this resistance, they have not had much success in stabilizing the price above it; This can be attributed to the lack of demand at higher levels.

The price of Bitcoin on the chart is creating a head and shoulders pattern. This pattern is completed by reaching the price and closing below the neckline. In this case, the price is likely to reach the target of $ 28,939. The area is not far from the 50-week moving average (SMA50) at $ 27,335.
The 20-day moving average is flatting at 47,444 and the Relative Strength Index (RSI) is a negative divergence that indicates a weakening of price acceleration.
This downside view will be invalidated if buyers raise the price of Bitcoin to $ 60,000 to $ 64,849. In this case, the price of Bitcoin will reach Fibonacci 161.8% in the area of $ 80,803.
- Resistors: 47,444 – 60,000 – 64,849 – 80,803
- Supports: 28,939 – 27,335
Weekly technical analysis of Ethereum prices
The price of Ethereum has entered a modified phase a few days after experiencing a sharp jump. Ethereum fell below the 20-day moving average (EMA20) to $ 3,431, but yesterday buyers tried to stop the fall in the Fibonacci 38.2 range and the $ 3,195 level.
If the price recovers from the current level and exceeds $ 3,600, buyers will try to raise it to $ 4,200. Meanwhile, the 20-day moving average has flattened and the relative strength index has entered the middle range; This means that the price acceleration is likely to weaken.
If buyers fail to defend the $ 3,195 support, the 50-day moving average is likely to continue to fall to the $ 2,709 level. This can delay the start of the next uptrend.
- Resistance: 3,431 – 3,600 – 4,200
- Support: 3,195 – 2,709
Weekly Binance Price Technical Analysis
The price of Binance has reached below the 50-day moving average at $ 520 for the first time since December 2020. The 20-day moving average is downwards at the $ 585 level and the relative strength index is below 42; This means that sellers have a higher hand in the market.
If the current price recovery trend stops at the 20-day moving average, it will indicate that traders are trading in every price rally. This raises the possibility of a reduction to $ 480. In that case, the Binance price may fall to $ 428 first and then to $ 348.
A break above $ 615 will be the first sign that Binance is gaining momentum. The move indicates that the correction is over and that the digital currency is ready to resume its uptrend.
- Resistances: 585-615
- Supports: 480 – 428 – 348
Specific Cardano Price Technical Analysis
Cardano prices are on a strong uptrend. The digital currency reached a new high of $ 2.34 two days ago. After reaching this historic high, traders began to withdraw profits. If the price falls below $ 1.95, the Cardano price may fall to the 20-day moving average at $ 1.71.
A strong recovery from the 20-day moving average will indicate that market sentiment remains bullish and traders are buying at the price floor. On the other hand, breaking the price below the 20-day moving average indicates that supply is higher than demand, and this may reduce the price to a simple 50-day moving average at $ 1.39.
Even if the price jumps from the current level and reaches above $ 2.34, the price of Cardano may continue to rise. The next target in this trend will be $ 2.82 and then $ 3. Moving averages have an upward slope and the relative strength index is in the range of 63, which indicates that the ascent is easier for Cardano.
- Resistances: 2.34 – 2.82 – 3
- Supports: 1.95 – 1.71 – 1.39
Dogecoin price specific technical analysis
Buyers are currently looking to defend the 20-day moving average at $ 0.46. If successful, the Dogecoin price could rise to $ 0.59. In this area, buyers are facing a lot of resistance from sellers.
If the Dogecoin price fluctuates below $ 0.59, it is likely to fall below the 20-day moving average. If the price falls to this level, we may see a decrease in the price of Dogecoin to the significant support of $ 0.35. A strong reversal of power in this area could cause Dogecoin to fluctuate between $ 0.35 and $ 0.59 in the next few days.
On the other hand, if buyers raise the price to $ 0.59, there is a possibility of re-testing the historic high of $ 0.73. Breaking this resistance paves the way for $ 0.83 and then $ 1.
- Resistances: 0.59 – 0.73 – 0.83
- Supports: 0.46 – 0.35
Specific Ripple Price Technical Analysis
Buyers traded in support of the symmetrical triangle pattern, which indicates lower levels of purchasing. At the moment, buyers are looking to raise the price to the resistance line of this pattern.
If successful, the Ripple price could reach a 52-week high of $ 1.96 by increasing price acceleration and rally. In this area, Ripple is facing tough resistance, but if buyers can break it, it is likely to climb to $ 2.68.
The smooth line of the 20-day moving average in the $ 1.43 area and the relative strength index above 53 do not indicate the absolute superiority of buyers over sellers. If the Ripple price falls below the resistance line of the triangle pattern, it is likely to fluctuate within this pattern in the next few days.
If the Ripple price falls below the triangle pattern, it will be in the sellers’ favor and there is a possibility that it will fall below 0.88.
- Resistances: 1.96 – 2.68
- Supports: 1.43 – 0.88
Specific technical analysis of Polkadot price
Polkadot was able to break the $ 44 resistance on Friday, but buyers failed to maintain it and reach higher levels, and sellers pushed the price below $ 44 the next day.
The 20-day moving average is clearing at $ 39.34 and the relative strength index is in the middle range; This means that transverse fluctuations can be expected in the next few days.
Breaking the price below $ 32.50 could pave the way for lower price support at $ 26.5. A jump from this level will indicate a stabilization of the price at lower levels.
On the other hand, if the Polkadot price starts to rise from the current level and reaches above $ 44, it indicates that the sentiment in the market is still positive and buyers will continue to buy at lower levels. It can be said that this positive mentality increases the probability of re-testing the historical peak of $ 49.78.
- Resistances: 44-49.78
- Supports: 39.34 – 32.50 – 26.5
Specific technical analysis of Bitcoin Cash price
Bitcoin Cash broke the 20-day moving average on Saturday at $ 1,178 and stabilized below it. The next day, buyers tried to close the price again above the 20-day moving average, but failed. This caused us to see an increase in sales pressure and a drop to the psychological level of $ 1,000 yesterday.
Buyers are likely to call everyone who looks appropriate, if there are only a few. Any revival rally in this area is likely to face heavy resistance at the 20-day moving average at $ 1,170. The next resistance, on the other hand, is in the $ 1,362 area.
If the price falls below this level, the price of Bitcoin Cash may fluctuate sideways for several days.
This neutral approach is nullified if the price of Bitcoin Cash falls below the simple 50-day moving average at $ 922. This could pave the way for the fall to $ 700. On the other hand, if the price crosses $ 1,362 and closes, it will be in the buyers’ interest.
- Resistances: 1,170 – 1,362
- Supports: 1,000 – 922
Specific Litecoin Price Technical Analysis
It is possible that the failure of buyers to take advantage of the breaking of the uptrend pattern has led to large profits in the short term. This reduced Litecoin last week to a 20-day moving average at $ 108.
Although buyers tried to revive the price a little later, the trend stopped at $ 339. Continued market pressure pushed the price of Litecoin below the 20-day moving average.
Yesterday, buyers tried to support the simple 50-day moving average at $ 270. However, the moving average started to decline and the relative strength index fell below $ 45; These events can mean that sellers want to show their power in the market again.
If the price of Litecoin falls below the 50-day moving average, there is a possibility of increasing sales pressure and may cause the price to fall below the support line of the corner pattern. This analysis loses its validity if buyers raise the price above $ 340.
- Resistance: 340
- Supports: 270
Uniswap price specific technical analysis
The price of Uniswap fell below the support line of its ascent channel yesterday, but the sellers could not take advantage of this position. Buyers are likely to call everyone who looks appropriate, if there are only a few.
However, the 20-day moving average at $ 37.72 is moving down, and the relative strength index is in the negative range, which makes things a little better for sellers. If the price closes below this channel, it will indicate a change in trend.
The price of Uniswap may fall in the support area of $ 27.5 to $ 25 and then reach $ 20. This view will lose its credibility if buyers raise the price to $ 40
- Resistances: 37.72 – 40
- Supports: 27.5 – 25 – 20
Read the technical analysis of Bitcoin, Ethereum, Binance Coin, Cardano, Dodge Coin, Ripple, Polkadot, Bitcoin Cash, Light Coin and Uniswap for today:


Leave a Reply