
Weekly Technical Analysis of Cryptocurrencies March 2
Weekly Technical Analysis of Cryptocurrencies February 23 Technical analysis of Bitcoin, Ethereum, Ripple, Bitcoin Cash, Light Coin, Cardano, Binance Coin, Polkadot, China Link and Stellar prices for today:
Weekly technical analysis of bitcoin prices
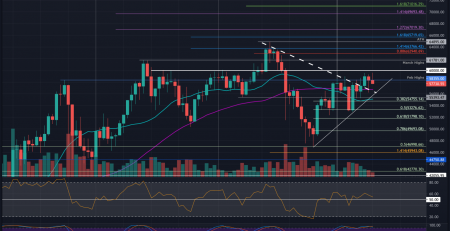
The price of Bitcoin fell to its $ 43,006.77 level on February 28, and the long wax of the price candle in the daily time frame indicates that buyers have used the price drop to accumulate their positions at lower levels. The group is currently trying to stabilize the price above the 20-day moving average (EMA 20 – blue line in the picture) at $ 47,711.

If successful, the $ 52,000 level will be considered the next price target. Vendors are likely to defend this level. If the price rolls down after hitting this resistance, it is likely to enter the consolidation phase and price fluctuations in the price range of $ 43,000 to $ 52,000 over a period of several days.
The horizontal slope of the moving averages and the placement of the Relative Strength Index (RSI) above the level of 55 indicate the possibility of cross-price fluctuations in the short term. However, if the upward acceleration of the price increases and buyers push the price above the level of $ 52,000, the price ceiling of $ 58,341.03 may be seen again. This uptrend will be eliminated with the price moving from the current levels and breaking below the simple 50-day moving average (SMA 50 – red line in the picture) at $ 41,313. Such a move warns of the possibility of a deeper price correction to $ 28,850.
- Resistances: 52,000 – 58,341.03
- Supports: 47,711 – 43,000 – 28,850
Weekly technical analysis of Ethereum prices
A fall in the Ethereum price below the moving average indicates that the price is entering a correction phase, but the high wick of the price candle on February 28 points to buyers defending support for the 38.2% Fibonacci retracement level at $ 1,413.

Buyers in the current situation are trying to recover and stabilize the price above the simple 50-day moving average (SMA 50 – red line in the picture) at $ 1,509. If successful, the next target will be the 20-day moving average price (EMA 20 – blue line in the picture) at $ 1,624, which is a heavy resistance.
During the price correction phase, sellers enter the market in recovery waves or buyers close their open positions. The price rotation after hitting the 20-day moving average downwards also indicates negative market sentiment. In the current situation, sellers will try to lower the price below $ 1,289. If successful, the price could drop to the 61.8% Fibonacci retracement level at $ 1,026.
On the other hand, if buyers push the price above the 20-day moving average and stabilize, there is a possibility that the $ 2,049 ceiling will be seen again.
- Resistance: 1,624 – 2,000 – 2,049
- Support: 1,509 – 1,413 – 1,289 – 1,026
Weekly Technical Analysis of Cardano Price
The long wick of the Cardano price on February 27 indicates a trading profit near $ 1.5. However, the long wick of the daily candle on February 28 announces the accumulation of buyers at lower levels.
Although the uptrend of moving averages is a good sign, a negative divergence in the Relative Strength Index (RSI) indicates a possible weakening of the momentum or an uptrend. If the bear moves the price below $ 1.16, it is likely that the price will continue to fall to $ 1.02. Monitoring this level will be important because with the price jump, we will be aware of the accumulation of buyers at lower levels.
Technical Analysis of Cryptocurrencies
A break above the $ 1.50 resistance will signal the beginning of the next bullish wave with a target of $ 1.83 and above $ 2. This view will be eliminated with the price falling below $ 0.98 support.
- Resistances: 1.50 – 1.83 – 2
- Supports: 1.16 – 1.02 – 0.98
Weekly Technical Analysis of Binance Coin Price
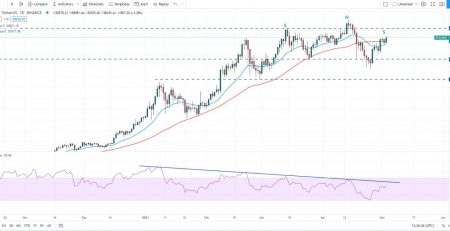
The Binance Coin jumped above $ 20 on the 28-day moving average (EMA 20 – blue line in the picture) on February 28 and pushed buyers above the downtrend line. Stabilizing the price above this resistance will mean the beginning of the price recovery process.
The upward slope of the moving averages and the placement of the relative strength index (RSI) above the level of 60 show the superiority of buyers. The first target price on the way up will be $ 281 and above it $ 309,4995.
On the other hand, if the price fails to stabilize above the downtrend line, it can be said that buyers who have entered the market at higher levels are leaving their positions. If the price rotates and moves below the 20-day moving average, there is a possibility of a deeper correction.
- Resistances: 281 – 309.4995
- Supports: 200
Weekly technical analysis of Polkadot prices
In an uptrend, buyers enter the market with a drop in prices to the 20-day moving average (EMA 20 – blue line in the picture), as this method provides a low risk entry point for trading. With these interpretations, the price jump from this average will be an indication that the uptrend will remain intact.
The slope of both moving averages is bullish and the Relative Strength Index (RSI) is above the 64 level. These factors will strengthen the scenario of continuing the upward trend. If the price of Polkadot is pushed above the resistance of $ 35.6618, the price growth will be possible up to $ 42.2488.
The uptrend will be eliminated by turning it from high resistance and break (breakout) below the 20-day moving average at $ 31. Such a move indicates the easing of situations by buyers in price recovery waves.
- Resistances: 35.6618 – 42.2488
- Supports: 31
Ripple Price Weekly Technical Analysis
Buyers are trying to defend the Ripple price at the simple 50-day moving average (SMA 50 – red line in the picture) at $ 0.40. If the current jump stays stable, the price is likely to rise to the $ 0.65 target.
However, cows in the market will not have an easy job because the downward slope of the 20-day moving average (EMA 20 – blue line in the picture) and the relative strength index (RSI) below its mid-level, warns the sellers’ superiority.
Weekly Technical Analysis of Cryptocurrencies March 2
If the price moves below current levels or high resistance in the 20-day moving average at $ 0.472, market bears will try to lower the price below the simple 50-day moving average. If successful, it is likely to continue to fall to $ 0.359. Any break below this level could be the beginning of a deeper price correction up to $ 0.25 support.
- Resistances: 0.65
- Supports: 0.472 – 0.40 – 0.359 – 0.25
Weekly technical analysis of Litecoin price
On February 28, the price of Litecoin fell below the simple 50-day moving average (SMA 50 – red line in the picture) at $ 166 and has been pulled down to the uptrend line. However, the long wick of the price candle in the daily time frame shows a strong buying flow at lower levels. Buyers are currently trying to push the price towards the resistance of $ 185.58.
Buyers and sellers are likely to face a 20-day moving average (EMA 20 – blue line in the picture) at $ 186. If the price moves down from the resistance, the sellers will try to lower it below the uptrend line. In this case, it will be possible to continue the fall of the price up to $ 120.
Technical Analysis of Cryptocurrencies
On the other hand, if the price is driven by buyers above the 20-day moving average, the price is likely to rise to $ 205 and above $ 240.
- Resistances: 185.58 – 205 – 240
- Supports: 120
Chainlink Weekly Technical Price Analysis
Buyers are trying to delay the uptrend in China Link price at the simple 50-day moving average (SMA 50 – red line in the picture) at $ 25.26. Although the price moved below this moving average on February 28, the long wick of the price candles indicates the buying trend at lower price levels. The price in the current situation is trying to start a recovery process.
If the bulls push the price above the 20-day moving average (EMA 20 – blue line in the picture) at $ 27.98 and resistance at $ 29.33, the correction is probably over. Under these circumstances, the price is likely to rise to $ 34 and above that to the historic high of $ 36.93.
On the other hand, if the price moves down from the upside resistance, the sellers will try to guide and stabilize it below the simple 50-day moving average. In this case, the price will fall to $ 20.11.
- Resistances: 27.98 – 29.33 – 34 – 36.93
- Supports: 25.26 – 20.1111
Weekly Technical Analysis of Stellar Price
On February 27, the Stellar price jumped above the 20-day moving average (EMA 20 – blue line in the picture) at $ 0.428, but buyers were not able to break above the bearish channel. This indicates a lack of demand at higher price levels.
On the plus side, however, buyers on February 28 successfully defended the 50-day moving average (SMA 50 – red line in the picture) at $ 0.369. If the price moves above the 20-day moving average, buyers will try again to push the price above the uptrend channel. If successful, the price is likely to rise to $ 0.50.
Technical Analysis of Cryptocurrencies
On the other hand, if the price moves down from the 20-day moving average, it is likely to fall again to the simple 50-day moving average. The horizontal slope of the moving averages and the placement of the Relative Strength Index (RSI) near its mid-range will indicate cross-price fluctuations over several days.
- Resistances: 0.428 – 0.50
- Supports: 0.369
Weekly Technical Analysis of Bitcoin Cash Price
The price of Bitcoin Cash has moved below the uptrend line on February 28, but as the price candle shows, buyers have entered the market with the price falling to this line. If the price jump manages to stabilize, there is a possibility that the price recovery wave will start with the target of the 20-day moving average (EMA 20 – blue line in the picture) at $ 551.
Sellers are likely to defend the 20-day moving average. If the price moves down from this level, it can be said that the market sentiment is still negative. Any break below the uptrend line could result in a drop in prices to $ 370.
The slope of both bullish moving averages is rotating downwards and the Relative Strength Index (RSI) is in its negative area. These factors show the superiority of sellers. With these interpretations, if buyers manage to guide and stabilize the price above the 20-day moving average, it is likely to rise to $ 631.71.
- Resistances: 551 – 631.71
- Supports: 370


Leave a Reply