
Weekly technical analysis of cryptocurrencies May 11
Weekly technical analysis :Read the technical analysis of Bitcoin, Ethereum, Binance Coin, Dogecoin, Ripple, Cardano, Polkadot, Bitcoin Cash, Litecoin and Chainlink prices for today:
Weekly technical analysis of bitcoin prices
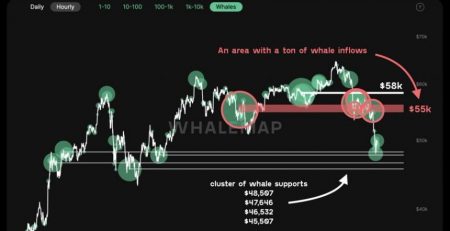
The price of Bitcoin was caught between the moving average and the resistance of $ 58,966 in the last two days. The small volatility range of bitcoin indicates that there is a balance between buyers and sellers.

If this uncertainty eventually leads to a price reduction, the price of Bitcoin is likely to fall to $ 52,323. If buyers seek to defend this support and succeed, Bitcoin could extend its consolidation phase from $ 52,323 to $ 58,966 and continue this trend for several days.
The 20-day moving average is gradually rising to $ 56,611, with the Relative Strength Index (RSI) near the middle of the chart, indicating a balance between supply and demand.
If the price stabilizes above $ 58,966, it is likely that the situation will change in favor of buyers. That could push Bitcoin to a record high of $ 64,849 last month. Breaking this resistance can indicate the continuation of an upward jump.
On the other hand, a drop below $ 52,323 is likely to indicate a more sharp correction to $ 46,985. Breaking this support may cause traders to sell out of anxiety.
- Resistances: 58,966 – 64,849.27
- Supports: 52,323 – 46,985
Ethereum proprietary technical analysis
Ethereum has continued its leap in recent days without stopping. On Sunday, we saw the formation of Dodge Kendall pattern in the chart. Yesterday, buyers increased the price of Ethereum to a new historical high by increasing their dominance in the market. The recent jump saw the Ethereum relative strength index reach above 83.
The range of buy saturation in the relative strength index indicates that the sell-off in the Ethereum market has increased and traders are afraid to lag behind the rally. In general, such rallies will stop when buyers finish their shopping. The price of Ethereum is likely to rise to $ 4,528 and then to $ 5,000.
Consecutive corrections for 3 days can be the first sign of a slowdown in the market. A fall below the 20-day moving average at $ 3,173 could also signal the beginning of a stronger reversal.
- Resistance: 4.528 – 5,000
- Support: 3,173
Binance Coin Specific Technical Analysis
Binance Coin reached a new all-time high of $ 691 yesterday, but buyers are now trying to stabilize the price above the $ 680 level from which the jump started. Kendall’s high spirits yesterday show that there is not much demand at higher levels.
The upward slope of moving averages indicates that buyers have more control over the market, but a negative divergence in the relative strength index indicates that Binance Coin price acceleration is likely to weaken. Breaking down below the 20-day moving average at $ 599 may be a sign of more severe correction.
On the other hand, if the price rises above the current level or the 20-day moving average, buyers will once again try to push the Binance Coin above $ 680. If successful, Binance Coin could rise to $ 780 and then to $ 808.
- Resistances: 680-780-808
- Supports: 599
Dogecoin proprietary technical analysis
Dogecoin witnessed a sharp correction on Sunday, but as can be seen from Kendall’s great daily joy, buyers strongly protected the 20-day moving average at $ 0.44. Buyers were unable to continue the recovery, and the Dogecoin price is continuing to move towards the 20-day moving average.
The 20-day moving average is slowly clearing and the relative strength index has fallen below 58, indicating a weakening of price acceleration.
If Dogecoin recovers from the 20-day moving average, it indicates that we are seeing higher volume purchases at lower levels. Such fluctuations can cause price changes over a fixed period in the next few days.
This analysis will lose its validity if sellers reduce the price to the 20-day moving average. In that case, the price may fall as low as $ 0.38 to 6:38% at Fibonacci.
- Resistances: 0.60 – 0.70
- Supports: 0.44 – 0.38
Ripple Specific Technical Analysis
Ripple prices have broken the downtrend several times since the beginning of last month, but buyers have not been able to stabilize the high price in this area. This may mean that traders use price rallies to lighten their buying positions.
Buyers will push the price up to $ 1.66 and try to stabilize in this area. The move is aimed at retesting the $ 1.96 peak (the highest price in 52 weeks). The upside of the 20-day moving average in the 1.45 area and the relative strength index in the 56 range also indicate that buyers are slightly more powerful than sellers.
If the price falls below the 20-day moving average, this analysis will be invalidated. Such fluctuations would indicate that supply is greater than demand. The Ripple price may then fall to a simple 50-day moving average (SMA50) at $ 1.16.
- Resistances: 1.66 – 1.96
- Supports: 1.45 – 1.16
Cardano Specific Technical Analysis
Cardano formed an engulfing pattern on Sunday, indicating a high buy volume in the $ 1.48 area. Buyers, however, failed to keep up with price acceleration, and Cardano’s price formed an insider-day pattern.
If buyers do not stop their activities at the current level, it will show their strength and can increase the likelihood of continued price spikes.
The 20-day moving average at $ 1.45 and the relative strength index in the buy saturation range also show that the climb is the easiest path for Cardano. Breaking the $ 1.83 resistance paves the way for $ 2 and then $ 2.25.
On the other hand, if the price of Cardano falls below the 20-day moving average, it will indicate a bull trap. This could lower the price to $ 1.28.
- Resistances: 1.83 – 2.25
- Supports: 1.48 – 1.28
Polkadot proprietary technical analysis
The Polkadot is trading between the moving average and the $ 42.28 resistance. Low amplitude near this resistance is a positive sign; Because it shows that traders are not in a hurry to close their long positions.
If buyers can fix the price above $ 42.28, it will indicate that demand is higher than supply. That could push prices up to a historic high of $ 48.36. At this level, sellers have formed a strong resistance.
However, if buyers raise the price above $ 48.38, Polkadot could start the trend at $ 58.06.
In addition, if the price falls below the moving average, it is likely to fall to $ 34.36 and then to $ 32.56. In this case, the price of Polkadot may fluctuate in the range of $ 26.50 to $ 42.28 for a few days.
- Resistances: 42.28 – 48.36 – 58.06
- Supports: 34.36 – 32.56 – 26.50
Bitcoin Cash proprietary technical analysis
The price of Bitcoin Cash is hovering near its 52-week high of $ 1,600; This resistance can be understood from the joy of Kendall yesterday. If the price of Bitcoin Cash falls below $ 1400, it is likely to fall to Fibonacci 38.2% at the level of $ 1,263. In this case, the digital currency may fluctuate transversely for several days.
The first sign of weakness will be the breaking of $ 1,263 support. If the price falls below the 20-day moving average on the level of $ 1,134, the sheet will return to the benefit of sellers.
However, the slope of the moving averages is up and there is a relative strength index in the buying saturation range, which indicates that a rise is more likely than a fall.
If the price jumps above this level or $ 1,400 and breaks 1,600, the price of Bitcoin Cash can start an upward trend; In this case, the main target will be 2,147.
- Resistances: 1,600 – 2,147
- Supports: 1400 – 1,263 – 1,134
Litecoin Specific Technical Analysis
Litecoin on Sunday managed to break the resistance line of the uptrend, which indicates an increase in price acceleration. The price of Litecoin hit a new all-time high of $ 412 yesterday, but the upside shows that traders are looking to reap the benefits of the market.
If Litecoin jumps from the level from which it started the jump, it will indicate that buyers are buying at any price floor. In such a case, there is a possibility that the uptrend will continue and $ 463 and $ 500 will be the targets.
On the other hand, if the price re-enters the wedge pattern, it indicates that Sunday’s jump was a bull trap. In this case, there is a possibility of falling to the 20-day moving average at $ 309. The widespread price recovery at this level will indicate that the sentiment in the Litecoin market is bullish. In addition, reaching below the 20-day moving average opens the way for the wedge support line to fall.
- Resistances: 412 – 463 – 500
- Supports: 309
Chainlink proprietary technical analysis
Last week, buyers pushed the Chainlink price up the resistance channel line, but could not take full advantage of the jump. After a few days of delay, on Sunday we saw buyers move the Chainlink price to $ 52.42 with a decisive move.
However, buyers were once again unable to stabilize the price after the jump, and sellers are now looking to push the price back into the uptrend channel. If successful, they are likely to fall to the $ 43 moving average on the 20-day moving average.

If the price recovers from the 20-day moving average, buyers are likely to try again to continue the uptrend. On the other hand, a fall in the price below the 20-day moving average will indicate that the current jump is a bull trap. Chainlink prices are likely to fall to the channel support line.
- Resistances: 52.42
- Supports: 43
Weekly technical analysis of cryptocurrencies May 11


Leave a Reply