
Weekly Technical Analysis of cryptocurrencies June 1
Weekly Technical Analysis Read the technical analysis of Bitcoin, Ethereum, Binance Coin, Cardano, Dodge Coin, Ripple, Polkadot, Bitcoin Cash, Light Coin and Uniswap for today:
Weekly technical analysis of bitcoin prices
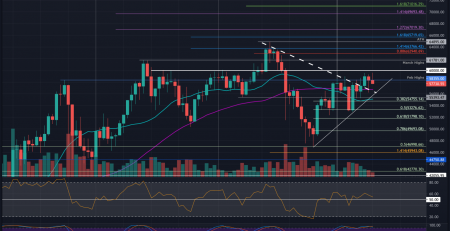
Bitcoin prices are on a downward trend. Moving averages have a downward slope and the Relative Strength Index (RSI) is in the negative range, indicating that sellers have a higher hand in the market. However, buyers also have plans for themselves and are trying to start a price recovery process.

Bitcoin used to form a triangular pattern. If buyers can stabilize the price above the triangle resistance line, there is a 50% chance of climbing with Fibonacci at $ 44,750. After that, the 50-day moving average (SMA50) is at $ 50,161. Such a move could signal the end of the downtrend.
On the other hand, if the price goes down this resistance line, we may see fluctuations within this pattern in the next few days. Breaking the triangle support line and stabilizing the price will also indicate the continuation of the downtrend.
Sellers in this case may lower the price to $ 30,000, and if this level is broken, there is a possibility of increasing sales pressure. This increase in sales pressure could lead to a drop to $ 28,000 and then to $ 20,000.
- Resistances: 44,750 – 50,161
- Supports: 30,000 – 28,000 – 20,000
Ethereum Price Specific Technical Analysis
As traders increased their activity, Ethereum prices jumped earlier than their symmetrical triangle support line. At the moment, it is possible that buyers will try to push the price up to the top of the resistance line. In this area, we will see widespread resistance from sellers.
If buyers push the price to the top of the triangle, there is a chance of jumping to Fibonacci 61.8% at $ 3,362.72. Such a move indicates heavy purchases at lower levels. A break of $ 3,362.72 could signal the end of the downtrend.
However, sellers do not seem to give in to this simplicity. The 20-day moving average (EMA20) slope is down at $ 2,756 and the relative strength index is in the middle range, indicating that sellers are slightly stronger than buyers.
If the price falls below the triangle resistance line, sellers will try to lower the price to the bottom of the triangle support line. If they succeed, there is a possibility of re-testing the floor on May 23 (June 2) at $ 1,728.74. The floor was formed by the emotional sale of traders.
- Resistances: 2,756 – 3,362.72
- Supports: 1,728.74
Specific Binance Coin Price Technical Analysis
Binance Coin fell below $ 306.61 on Sunday, but traders failed to keep selling pressure at lower levels. The Binance Coin rebounded rapidly the day after, reaching above $ 306.61, indicating a lower level of accumulation.
Buyers are currently trying to push the price above the 20-day moving average at $ 400, which is likely to act as a strong resistance. If the price of Binance Coin falls in this area, it will indicate that market sentiment is still declining and traders are trading in price rallies.
In this case, sellers will try to raise the price to $ 211.7. On the other hand, if buyers push the price above the 20-day moving average at $ 428, there is a possibility of jumping to the simple 50-day moving average at $ 512.
- Resistances: 400 – 428 – 512
- Supports: 211.7
Specific Cardano Price Technical Analysis
Cardano price fell below the 50-day moving average on Sunday, but sellers were unable to take advantage of the event. The cryptocurrency was revived the next day to above the 50-day moving average, indicating that buyers are buying at lower levels.
The 20-day moving average has flattened and the relative strength index is in the middle range, indicating a balance between supply and demand.
The situation will be in their favor if buyers can push the price above the downtrend line. In this case, the price is likely to rise to $ 1.94. Cardano next target will be the historic high of $ 2.47.
Weekly Technical Analysis of cryptocurrencies June 1
On the other hand, if the price falls below the downtrend line, sellers will once again try to break the $ 1.33 support. If they succeed, we may see the price fall to 1.24 and then $ 1.
• Resistances: 1.94 – 2.47
• Supports: 1.33 – 1.24 – 1
Specific technical analysis of Ripple price
On Sunday, we saw sellers lower the price of Ripple below $ 0.88, but failed to stabilize at this level. The next day, the Ripple price returned above $ 0.88, which indicates that buyers are very active in the market.
If buyers push the price up to the 20-day moving average at $ 1.08, it would indicate that $ 0.65 has been the Ripple floor. After that, you can expect a jump to the simple 50-day moving average at $ 1.32. After conquering this resistance, the next goal will be to cross the downtrend line.
This uptrend will be nullified if the price falls below the 20-day moving average. In this case, sellers will try to lower the price below $ 0.8, and if successful, we can expect to fall back to support at $ 0.65.
• Resistances: 1.08 – 1.32
• Supports: 0.8-0.65
Dedicated Dogecoin price technical analysis
Dogecoin fluctuations have decreased due to the lack of strong buying or selling pressure. Moving averages have completed the downtrend and the relative strength index is in the downtrend range, indicating a higher hand for sellers.
If the price falls below the 20-day moving average at $ 0.36, traders will try to pull the Dogecoin price below the significant $ 0.21 support. If they succeed, the descending pattern of the head and shoulders will be completed. In this case, correction up to $ 0.1 and then 0.05 is likely.
Weekly Technical Analysis of cryptocurrencies June 1
On the other hand, if buyers raise the price to the 20-day moving average, a rise to the resistance of $ 0.47 is likely. Breaking this resistance will most likely lead to a rally of $ 0.59.
• Resistances: 0.47-0.59
• Supports: 0.36 – 0.21 – 0.1 – 0.05
Dedicated technical analysis of Polkadot price
The price of Polkadot is looking to recover from the $ 17.5 support. This is a positive sign; Because it shows that buyers are not waiting for the $ 15 floor to buy. It is likely to see a jump to $ 26.5, and the plan is likely to act as a strong resistance.
Moving averages have a downward slope and the relative strength index fluctuates below 40. These issues show that sellers have more power in the market. If the price falls below $ 26.5, you can expect cross fluctuations in the next few days.
The first move is for buyers to push the price above $ 26.5. In that case, the rally is likely to be up to $ 31.28, followed by a simple 50-day moving average at $ 33. In addition, if the price falls below $ 15, the ground is prepared for another downtrend.
• Resistances: 26.5 – 31.28 – 33
• Supports: 17.5 – 15
Uniswap price specific technical analysis
Uniswap is on a downtrend, but buyers are trying to reach a higher price peak at $ 21.5. On Sunday, the price of Uniswap jumped from support and now buyers are looking to push the cryptocurrency above the 20-day moving average at $ 28.27. After this level, the next target for buyers will be $ 30.
If they succeed, it can be said that the downtrend is over in the short term. After that, it is possible to see a rally to the simple 50-day moving average at $ 33.94. This area may be associated with hard resistance, but breaking this resistance can lead to a jump of up to $ 38.15.
Weekly Technical Analysis of cryptocurrencies June 1
The 20-day moving average has a downward trend, indicating that sellers are more powerful than buyers, but has a relative strength index above 44, which indicates the buyers’ intention to return.
If the price of Uniswap falls below the 20-day moving average and falls below $ 21.5, this uptrend will be invalid. Such fluctuations could lead to a fall below the May 23 floor at $ 13.04.
• Resistances: 28.27 – 30 – 33.94 – 38.15
• Supports: 21.5 – 13.04
Dedicated technical analysis of computer internet prices
PC Internet price fell below $ 120 to $ 168 on Friday, but vendors failed to lower the price to below $ 103.71 support. The price of this cryptocurrency has fluctuated between $ 103.71 and $ 120 over the past three days.
Fluctuations over a limited period indicate a lack of uncertainty in traders’ decisions. If these ambiguities are resolved and the price trend is low, it is likely to fall to the bottom of May 19 at $ 86.01. Reducing the price below this support can lower the price of PC Internet by up to $ 60.
Weekly Technical Analysis of cryptocurrencies June 1
On the other hand, if buyers raise the price above $ 120 and stabilize there, it will indicate that the sale has not been done at lower levels. In this case, we will see a gradual increase to $ 168. A jump above $ 168 could trigger a recovery rally. In this rally, Fibonacci potential target is 38.2% at $ 243.08.
• Resistances: 120 – 168 – 243.08
• Supports: 103.71 – 86.01 – 60
Specific technical analysis of bitcoin cache prices
Bitcoin Cash is looking to jump above $ 685.36. If buyers are able to stabilize the price above this resistance, it is likely to increase to the 20-day moving average at $ 821. This area is expected to act as a tough resistance.

If the price falls below the 20-day moving average, it indicates that market sentiment is still declining and traders are trading in every minor rally. If sellers lower the price below $ 600, it is likely to fall to $ 468.13.
On the other hand, if buyers can push the price above the 20-day moving average, it indicates that demand is higher than supply. That could trigger a 38.2% jump to $ 919.6 at Fibonacci. The next target in this case is Fibonacci 50% at 1,059.07.
• Resistances: 685.36 – 821 – 919.6 – 1,059.07
• Supports: 600 – 468.13
Weekly Technical Analysis of cryptocurrencies June 1


Leave a Reply