Technical analysis training; Trend – Section 4
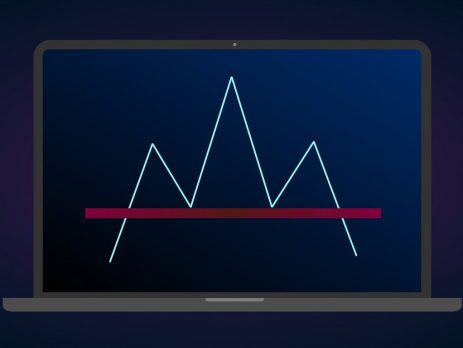
Technical Analysis Training: Trend is the most important concept that you should be familiar with in technical analysis. The concept of

Technical Analysis Training: Trend is the most important concept that you should be familiar with in technical analysis. The concept of
Technical analysis training; Chart Scale and Trading Volume - Part 3: Price charts include the horizontal time axis and the vertical price axis. The price history shown in these charts is raw and unchanged. The scale used in line charts is linear by default. To better understand the linearity of...
Technical analysis training; Types of Charts - Part Two , In general, there are three types of charts that can be used in technical analysis according to the trader's

Technical analysis training; Assumptions - Part One, Technical Analysis is a way to evaluate the market using volume and price statistics

What is time frame in technical analysis? If you are in the financial markets or you are interested in discussing the analysis of these markets
What is the pattern of head and shoulders in technical analysis? + Trading method, head and shoulders; A popular pattern in technical analysis is that when seen on the chart we should be prepared for a price drop and a terrible downtrend. In this article, you will first get...
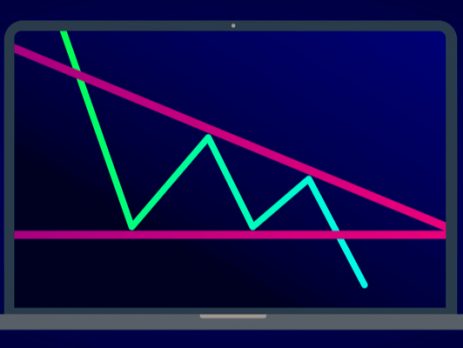
The triangle pattern is one of the most popular and reliable patterns in technical analysis
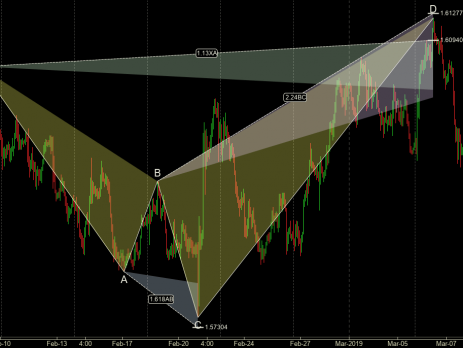
Another widely used harmonic pattern is the shark pattern. As you know, harmonic patterns in technical analysis are invented from a combination of Fibonacci numbers and geometric shapes. As a result
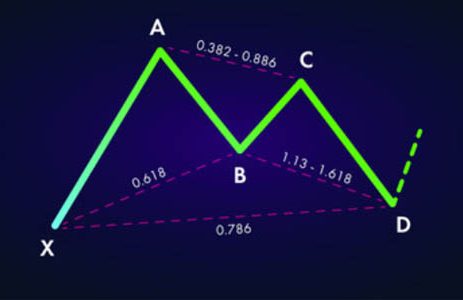
gartley model has many fans among technicians. Because this template provides very accurate conditions for assessing the validity of the template,