Harmonic pattern of crab and deep crab
Harmonic trading is a type of technical analysis that is widely used in the Forex, futures and stock markets. Harmonic trades use certain price patterns that are created based on certain Fibonacci ratios.
Harmonic trading is a type of technical analysis that is widely used in the Forex, futures and stock markets. Harmonic trades use certain price patterns that are created based on certain Fibonacci ratios.
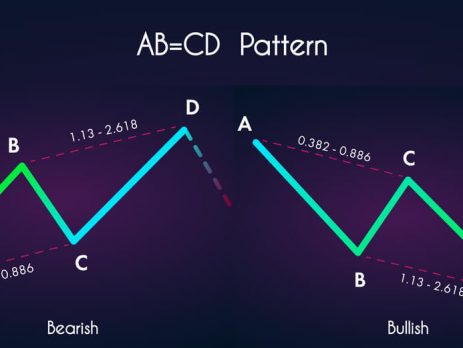
The ABCD pattern is one of the harmonic patterns used by technical analysts to predict prices. Some traders refer to the ABCD pattern as the AB = CD pattern.
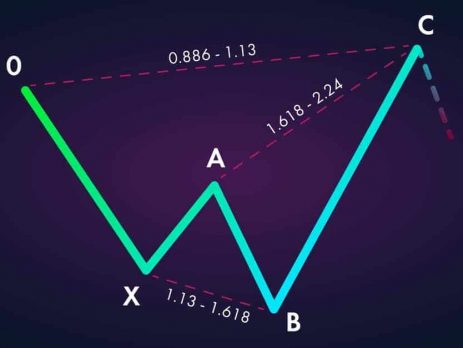
Harmonic patterns can be classified as both internal and external patterns. Internal patterns include patterns such as the Gartley pattern and the bat pattern
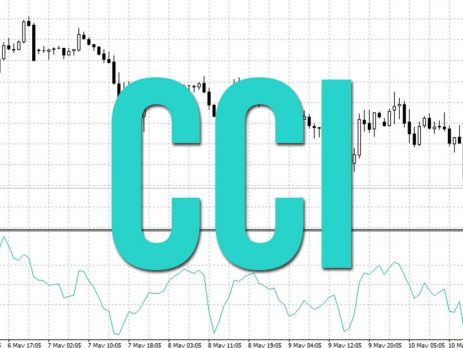
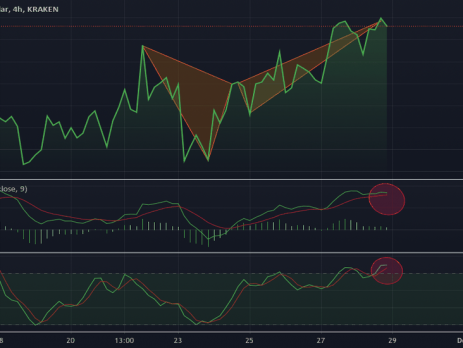
This indicator was first developed by Donald Lambert and is an indicator that is considered as part of the oscillators (it fluctuates in the range and its oscillation range is between -100 to +200) and the power of the oscillation acceleration in a share process to It looks good....
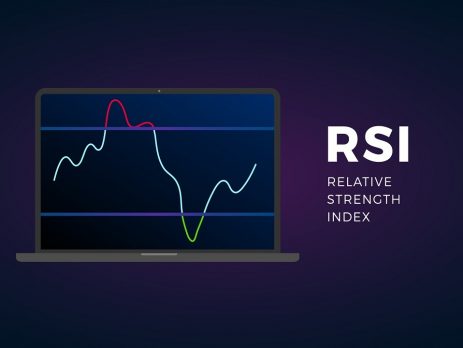
The RSI, which stands for Relative Strength Index, is calculated by complex mathematical relationships.
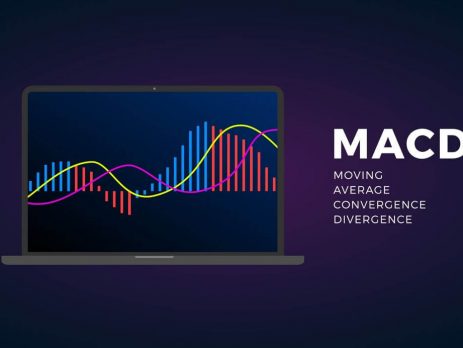
The MACD stands for Moving Average Convergence Divergence. This phrase means convergence and divergence of the moving average. This indicator was invented by Mr. Gerald Appel.
This indicator was first designed by a Japanese journalist named Goichi Hosoda in 1930.
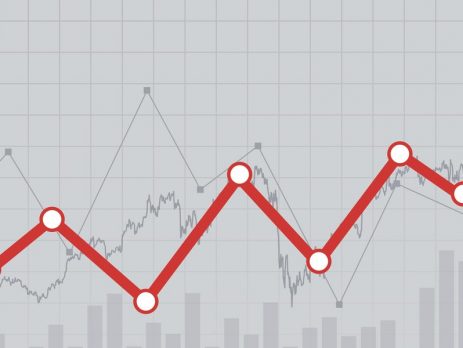
Using trend lines is one of the most widely used methods of identifying support and resistance points in the chart. But the correct way to draw the trend line is still questionable for many traders. In this article, we will go to the nature of trend lines and how...
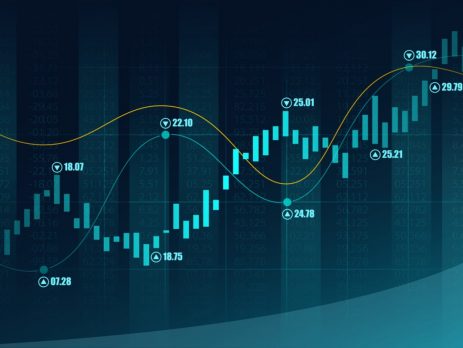
Technical analysis is the study of market behaviors using charts with the aim of predicting the future of price trends.