RSI indicator training
RSI indicator
The RSI, which stands for Relative Strength Index, is calculated with complex mathematical relations, which are beyond the scope of this discussion. RSI settings also generally use the 14-day adjustment. This indicator, like MACD, is classified as an oscillator because it always fluctuates between two levels, 0 and 100.
RSI applications:
As mentioned, this indicator fluctuates between two levels of 0 and 100. Meanwhile, the two key levels of 30 and 70 are called sales saturation and buy saturation levels, respectively. This means that whenever the RSI value falls below 30, it means that we are witnessing extreme sales in the market, and therefore there is a possibility of reducing the sales pressure and rising prices. Conversely, a RSI move above the 70 level means that the market is making extreme purchases, which may eventually end at any moment and see a drop in price.
RSI indicator training
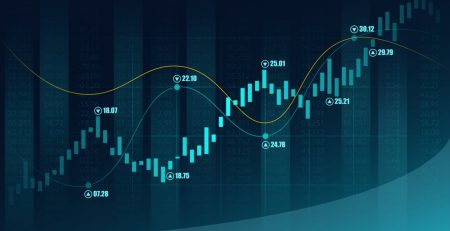
For example, look at the figure below, which shows the price chart stocks. As we can see, in the points represented by the vertical lines, we have seen the RSI enter the areas of saturation or saturation of sales, which are considered as a sign of a change in the direction of the price. For example, at the point indicated by the red arrow, the RSI has dropped to less than 30, which means extreme sales, and after a while we have seen a decrease in sales pressure and a rise in share prices. And in the next point, which is displayed with a green arrow, we have seen an increase in RSI to more than 70, which means extreme buying, and after a while we have seen a decrease in buying pressure and a drop in price.

The point to note about the RSI is that the RSI may leave the saturated areas, without falling or rising in price and only with price fluctuations. To clarify the issue, if we look again at the price chart, we see that in the area marked with a red line, the RSI has entered the saturation zone, but after a while, without a slight drop in price, only the price of the RSI fluctuates from The shopping saturation zone has been removed. So always keep in mind that the use of indicators alone can in some cases cause errors in decisions and must be used in conjunction with other tools.
Another interesting application of RSI is the use of trend lines with this indicator.
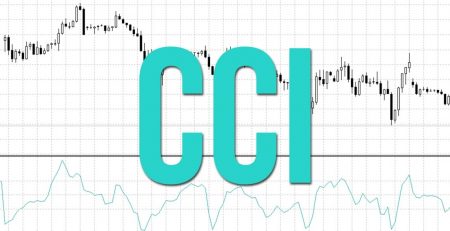
In other words, in the same way that we use trend lines for price, we can use the same lines for RSI in the same way. For example, consider the following diagram:

As shown in this figure, we can draw an uptrend line for the RSI indicator. We see how after this downward trend line was broken, we also saw a drop in price after the vertical line.
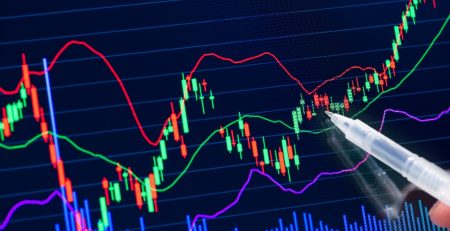
Note the following diagram:

You can see how the share price started to rise after breaking a downtrend line on the RSI indicator.
Another point about each indicator that we mentioned above is to use another tool alongside an indicator to reduce the amount of errors. For example, instead of using each of the RSI or MACD indicators alone, the two indicators can be used together at the same time so that these tools can cover each other’s errors.
RSI indicator training


Leave a Reply