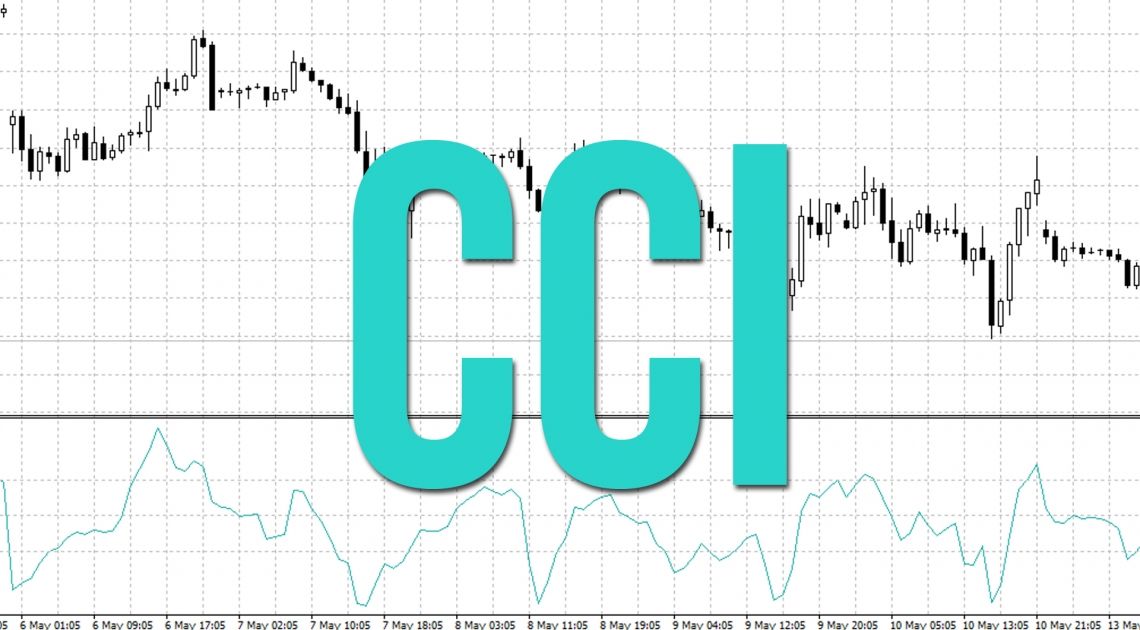
CCI indicator training
This indicator was first developed by Donald Lambert and is an indicator that is considered as part of the oscillators (it fluctuates in the range and its oscillation range is between -100 to +200) and the power of the oscillation acceleration in a share process to It looks good. Most fluctuations in this indicator (about 70 to 80%) occur in the range of -100 and +100.
The following items are used to calculate this indicator:
- Asset Price (PRICE)
- Moving Average (MA)
- Standard deviation (D)

Advantages of the CCI indicator
- The investor helps to identify the buying and selling saturation points in the share process.
- Examines changes in the direction of asset price movements.
- CCI is positive when the market is bullish, and negative when the market is bearish, except in cases where there is a divergence share trend.
Trend line break in CCI indicator
As you can see in the image below, in the price chart before the break of the stock trend line, the break of the indicator trend line has occurred and shows the change of the stock trend and the beginning of a new uptrend. That is what happened. So we can draw a trend line for the CCI indicator and the failure of this trend line can be considered as a signal.

Or in the image below, as you can see, after the failure of the CCI uptrend, the stock has entered the downtrend after a few candles. This is also a signal of a change in the share trend.

Divergence in the CCI indicator
In the image below, the hourly chart shows a positive divergence in the CCI indicator, after which the share has completely changed trend and has risen. The divergence of the CCI indicator is one of the strongest Mojo signals in the indicators.
As can be seen in the figure, when the share trend is upward, it is the same downward trend in the indicator. So there is a negative divergence in the indicator and after that the share has decreased. In the case of a positive divergence, the stock is also in a downtrend, but the CCI indicator has an uptrend, and in the picture it is clear that the uptrend is up.
tip
The standard SETTING of this indicator is generally 14 days (ie the price has been measured in the last 14 days of trading). We now have two options:
- If we choose less than 14 days, we will see more fluctuations and it is possible that these conditions will not prevail for a long time.
- If we choose more than 14 days, it is possible that the trend will stay in that position for a long time, and the reason is that because the time period has become longer, the fluctuations in the trend have decreased.
Conclusion CCI indicator
The most important thing to consider when using all indicators, including the CCI, is that indicators alone should not be the criterion for our buying, but can help as a support tool to identify the buy and sell signal. This indicator is also known as an oscillator indicator from the perspective that it shows the buying saturation points and the selling saturation points well for us. Another major advantage of this indicator is that it detects the movement and direction of the trend and determines the correct entry and exit point for us in the share.


Leave a Reply