
Divergence training in indicators
Divergence training in indicators :First, we introduce the indicators and then we provide training on the types of divergences that occur in prices and indicators.
What is an indicator?
Indicators are secondary tools that calculate prices based on price calculations, trading volume, monetary cash flows, and actual price fluctuations.
The application of these indicators is that it actually allows the analyst to gather additional information in excess of the overall share trend.
Indicators are divided into the following two categories from one perspective:
Leading indicators: These types of indicators are known as a type of signal to identify future events. In fact, it is the nature of predicting price events. Major leading indicators include oscillators. Oscillators also mean that they fluctuate in a certain range. For example, the RSI indicator is one of the fastest indicators and is also part of the oscillators because it fluctuates in the range of 0 to 100 (but usually between 30 and 70). During this fluctuation, over-bought and over-sold saturation points are also examined. The following figure shows an example of buy saturation and sell saturation in RSI. When we encounter buying saturation in the trend, we should expect the trend to decline over time, and if we reach the saturation point of the sale, the trend is ready to enter an uptrend.

Lagging indicators: This indicator provides the analyst with useful and valuable information about the share during the process. In principle, it does not have the predictive mode of the trend that is leading in the indicator. The focus of these indicators is more on the trading process and that they give less trading signals to traders. Bollinger Bands and Moving Averages are examples of these indicators.
The following figure is an example of a Bollinger band in stock and a pass in the daily chart.
In the Bollinger Bands chart, it has acted as a support and resistance line. The bottom lines are considered as stock support and the top lines are considered as stock resistances. In the following tutorials, the Bollinger Band will be examined in detail.
What is divergence?
Divergence generally means that the price and the indicator move in the opposite direction, and the result is generally that when the price diverges, the price stops moving and changes direction. Observing divergence in indicators is known as one of the very strong signals in the science of technical analysis.
Types of divergence
Divergence is divided into two categories:
Regular Divergence:
This typical divergence itself is divided into two categories: positive divergence and negative divergence.
Regular Negative Divergence: Occurs when the price forms a new ceiling, but the indicator fails to form a new ceiling above the previous one.

As we can see in the example above (hourly chart) there is a negative divergence (RD). The price has formed a new ceiling while the indicator has not been able to do so, and the emergence of this situation itself could be a warning to control the risk because the possibility of a market downturn has been confirmed by the MACD indicator.
For volatile traders (oscillators are people who are thinking of making a profit in the short term), this negative divergence is a sign that the market trend is entering a new downturn and thus the outlook. They do not subvert transactions favorably.
Positive Regular Divergence: This type of divergence occurs in a downtrend and is such that the price succeeds in forming a new floor, lower than its previous floor, but the indicator cannot form a new floor. The chart below shows this well.
As it is clear, after observing a positive divergence in the indicator, while the share price has a downward trend, we see an uptrend and a share growth.
Hidden divergence: This type of divergence usually occurs when the price is correcting itself. This divergence into two categories
Positive Hidden Divergence: Occurs when the price manages to form a floor higher than its previous floor but the indicator forms a lower floor than its previous floor. In the figure below, you can clearly see the discrepancy between the price and the indicator.

As can be seen in the figure, the uptrend has taken on a positive latent divergence in the price chart.
Negative hidden divergence: This state, which occurs during a downtrend, does not have the price of power to reach its previous ceiling, but the indicator manages to hit a ceiling higher than its previous ceiling. That in itself can be a warning to the stock that we should consider.
As can be seen in the picture, the price failed to build a new ceiling, so it entered a downward trend. (Marked with an arrow in the figure)
Examples of types of divergence
Positive divergence in the graph
The figure below is a daily chart. Where a positive divergence is observed. In this figure, the RSI indicator is examined.
As can be seen, although the share of price floors has a downward trend, but in the indicator, the corresponding floors have an upward trend, and as a result, there is a positive divergence, which has caused the share to grow in the short run. When using the RSI oscillator to detect divergence, because this indicator is one of the oscillators, the saturation points of buy and saturation are well known in it can be an important factor in recognizing divergence in the share process. Because divergences usually occur at the saturation points of buying or selling (read more to get acquainted with this indicator)
Positive divergence in the MFI indicator and change in the share trend
This image is a clock chart and the MFI indicator is checked in it. As we can see, the price chart is accompanied by a downward trend, but the MFI indicator has taken an upward trend, and finally the share is accompanied by a positive divergence, and the chart is facing a price increase.
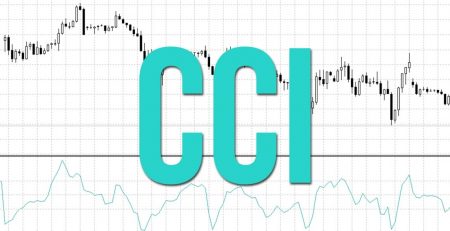
Negative divergence in the CCI indicator
The chart above, which is the share of the daily chart, shows a negative divergence in the CCI indicator. And as we can see, the share has experienced a slight decline after the divergence.
Conclusion
For technicians, divergence is an important factor in estimating the share trend, by identifying which it is possible to diversify their stock portfolio. The diagnosis of these divergences is made with the help of indicators and the share price trend. For this reason, indicators are one of the most accurate tools for detecting divergences. Finally, keep in mind that divergence, because it is the opposite of the direction of the stock movement, there is a possibility that the path is not complete, and if we base the purchase only on divergences, the failure rate in transactions increases.


Leave a Reply