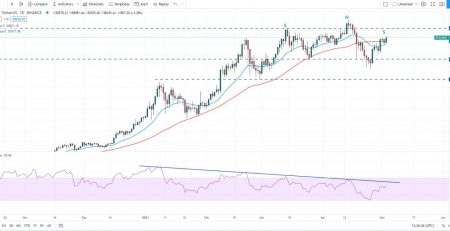
Bitcoin price technical analysis; Check support and resistance levels
Bitcoin price technical analysis; corrected yesterday after peaking at $ 64,892 and fell to $ 61,500. However, experts believe that the market signs are still bullish.
The price of bitcoin is in the green range above $ 62,000, according to NewsBT. Bitcoin is currently trading at $ 63,000 per unit, close to the $ 64,000 resistance.
After hitting a record high above $ 64,000, the price of Bitcoin first fell below $ 63,000. Bitcoin then fell as much as 50 percent to Fibonacci, which jumped to $ 59,700. At times, we even saw prices fall below the $ 62,000 support area.

Market buyers increased their activity in the range of $ 61,500. The price of Bitcoin managed to stabilize higher than Fibonacci 61.8%. This correction level, from the recent increase from $ 59,700 to $ 64,892.
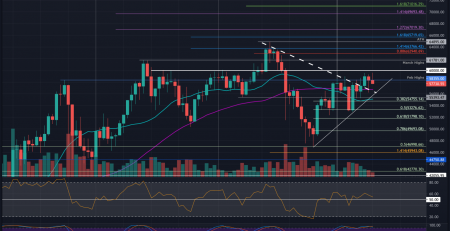
In the $ 61,850 support area, we are also witnessing the formation of an uptrend line in one-hour timeframes. The price of Bitcoin is recovering against the dollar and, as we said earlier, has stabilized in the range above $ 62,000. This area is above the 100-hour moving average (SMA100).
The first resistance to Bitcoin is $ 63,500 and $ 63,700. Then $ 64,000 will be the most important bitcoin resistance. By crossing this range, there is a possibility of reaching the price peak.
If Bitcoin does not peak above $ 63,500 and $ 63,700, it may undergo another correction; In that case, the first support would be $ 62,000.
The main support area for the Bitcoin price is around $ 61,800 and the trend line. By breaking this support, the price is likely to cross the $ 61,120 support in the short term.
The MACD has lost momentum in the uptrend zone in hourly timeframe. The Relative Strength Index (RSI) is currently close to the 50 area. $ 61,800 and $ 61,120 are the most important supports for Bitcoin. $ 63,500, $ 63,700 and $ 64,000 are the closest resistances on the chart, respectively.
Bitcoin price technical analysis; Check support and resistance levels


Leave a Reply