
Weekly Technical Analysis of Digital Currencies February 23
Weekly Technical Analysis of Digital Currencies February 23 Technical analysis of Bitcoin, Ethereum, Ripple, Bitcoin Cash, Light Coin, Cardano, Binance Coin, Polkadot, China Link and Stellar prices for today:
Weekly technical analysis of bitcoin prices
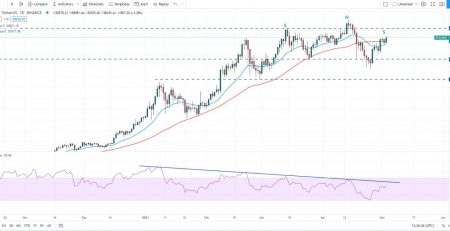
The price of Bitcoin moved above the uptrend channel on February 19, but this move failed to maintain its momentum. This can be considered a sign that the price trend is tired. Traders are rushing to aggressively save their trading profits. It pushed the price down to the 20-day moving average (EMA 20 – blue line in the picture) at $ 48,081.

However, the lower levels were attractive to buyers. This can be seen from the tall wicks of the price candle. If the price stabilizes above the mid-channel level, the market cows will try to push the price up the channel again.
If that happens, there is a possibility that the uptrend will continue with a target of $ 60,974.43 and above it up to $ 66,000. The upward slope of the moving averages and the placement of the Relative Strength Index (RSI) in the positive zone indicate that the market cows are still in power.
On the other hand, if the price stabilizes below the middle area of the bullish channel, sellers will try to break it again below the support of the 20-day moving average (EMA 20 – blue line in the picture). Under these conditions, there is a possibility of falling to the simple 50-day moving average (SMA 50 – red line in the image) at $ 39,885.
- Resistances: 60,974.43 – 66,000
- Supports: 48,081 – 39,885
Weekly technical analysis of Ethereum prices
The price of Ethereum has moved down from the resistance of the upward channel ceiling on February 20. This indicates a trading profit near $ 2,000 resistance.
The selling pressure has continued today and the price has been pulled down to the bottom of this uptrend channel. The positive point here is that buyers have entered the market in falling prices. This is evident from the high wicks of the price candle. If buyers manage to move the price above the 20-day moving average (EMA 20 – blue line in the picture) at $ 1,753, the upward momentum of the price will remain intact.
On the other hand, if the price stabilizes below this average, market bears will try to guide and stabilize the price below the uptrend channel and the simple 50-day moving average (SMA 50 – red line in the picture) at $ 1,465. If successful, the price correction is likely to deepen to $ 1,200 and below $ 1,000.
- Resistance: 1.753 – 2,000
- Support: 1,465 – 1,200 – 1,000
Weekly Technical Analysis of Binance Coin Price
The price of Binance Quinn has seen a lot of fluctuations over the past few days. Following the emotional rise in prices on February 19, traders aggressively saved trading profits the next trading day. Buyers have tried to keep the uptrend, but the trading reserve has not allowed the group to do so.
Buyers are trying to defend the 50% Fibonacci retracement level at $ 233,3485 and below that 61.8% level at $ 206,1262. In such cases, price fluctuations in a range of several days will be possible.
On the other hand, if the bears push the price below this level, there is a possibility that the price will expand to the 20-day moving average (EMA 20 – blue line in the picture) at $ 168. This level will be important for price monitoring, as a price break below that will signal a reversal and continue to fall to $ 118.
- Resistances: 253-333
- Supports: 233.3485 – 206.1262 – 168-118
Weekly technical analysis of Polkadot prices
The price of Polkadot moved above the ascending channel ceiling on February 19 and the new price ceiling is $ 42,2848. However, the high wick of the price candle indicates the flow of profit retention at higher levels.
Following the formation of the candlestick return pattern on February 21, the price has penetrated the channel again. However, buyers have entered the market with falling prices and pushed the price back to the top of the channel.
In the current situation, buyers will once again try to push the price above $ 42,2848 and continue the upward trend. On the other hand, market bears are trying to bring the price back into the channel. In this case, it will be possible to fall to the 20-day moving average (EMA 20 – blue line in the image) at $ 28.89.
- Resistance: 42.2488
- Supports: 28.89
Weekly Technical Analysis of Cardano Price
The price of Cardano on February 20 has risen above the resistance of $ 0.9817712 and has seen the level of 1.1980811 dollars. However, the long wick of the price candle in the daily time frame shows the flow of profit storage by traders.
The selling pressure has increased today, which has led to the price falling to the 20-day moving average (EMA 20 – blue line in the picture) at $ 0.834. At the same time, the high wick of the price candle yesterday indicates the entry of buyers into the market at lower levels.
If the price stabilizes above the $ 1 resistance level, buyers will try to continue the uptrend. A breakout above $ 1.1980811 will open the way for $ 1.25 and $ 1.50.
On the other hand, if the price moves below $ 0.9817712, it may once again fall to the 20-day moving average (EMA 20 – blue line in the picture). Monitoring this level will be important, because if it is violated, the correction could deepen up to $ 0.6879684.
- Resistances: 1 – 1.1980811 – 1.25 – 1.50
- Supports: 0.9817712 – 0.834 – 0.6879684
Ripple Price Weekly Technical Analysis
The Ripple price is still trading in the range of $ 0.50 to $ 0.65. Ripple has opposed the general trend yesterday, while all Altcoins were falling sharply. Finally, today, the price of Ripple is also associated with the market.
The price yesterday climbed to the level of $ 0.65155 today, but buyers have not been able to stabilize it at higher levels. This indicates that the bears have not yet left the market.
However, the uptrend slope of the 20-day moving average (EMA 20 – blue line in the image) and the relative strength index (RSI) in the positive area indicate the possibility of continuing the uptrend. If buyers manage to move the price above $ 0.65, it is likely to continue the upward trend to $ 0.78608.
The uptrend will be eliminated with the price moving above the current levels and falling below the $ 0.50 support. Under such circumstances, the downside is likely to continue to $ 0.3855.
- Resistances: 0.65 – 0.78068
- Supports: 0.50 – 0.3855
Weekly technical analysis of Light Coin price
Buyers were unable to stabilize the Light Coin price above the $ 240 resistance between February 17-21. This has ultimately led to short-term traders’ profit savings and falling prices.
The price of Light Coin is below the 20-day moving average (EMA 20 – blue line in the picture) at $ 198 and support at $ 185,521. The long wick of the candle in the daily time frame indicates the entry of buyers in the sheds. The horizontal slope of the 20-day moving average and the relative strength index (RSI) above the mid-range indicate a balance between supply and demand.
If the price stays above the 20-day moving average, buyers will try to continue the uptrend. On the other hand, if the price falls below the 20-day moving average, it is likely to continue to fall below the simple 50-day moving average (SMA 50 – red line in the picture) at $ 165. Below this level the next support is at $ 120.
- Resistance: 240
- Supports: 198-165-120
Weekly Technical Analysis of China Link Price
The price of China Link turned downwards from the resistance of the uptrend channel on February 20 and formed a Dodge candle in daily time frame on the next trading day. The price has finally changed its course to lower levels.
The price has moved below the 20-day moving average (EMA 20 – blue line in the picture) at $ 30 and the bottom of the canal. However, the long wick of the candle in the daily time frame indicates an aggressive buying flow to the buyers at lower levels.
If buyers manage to stabilize the price within the uptrend channel, it indicates that the uptrend will remain intact. On the other hand, the failure of the price below the uptrend again indicates a possible change in the trend.
The next price support on the downtrend will be the simple 50-day moving average (SMA 50 – red line in the picture) at $ 23.82. In case of violation of this support, the downtrend may be extended to $ 20.1111.
- Resistances: 30.80 – 35.5
- Supports: 30 – 23.82 – 20.1111
Weekly technical analysis of bitcoin cash price
The range of Bitcoin Cash price fluctuations has ended below $ 670 support with a break below. This indicates that the balance between supply and demand has shifted in favor of sellers.
The price is below the 20-day moving average (EMA 20 – blue line in the picture) at $ 610 and has dropped to the bottom of $ 407.80 in daily timeframe. However, buyers have entered the market with this support in the fall, which has led to a rapid jump in prices.
If the price stays above the 20-day moving average, buyers will try again to push it back in the $ 670- $ 745.39 range. Success in this indicates that the current reform is over.
On the other hand, if the price stabilizes below the 20-day moving average, it is likely to fall to $ 450 and then below $ 370.
- Resistances: 610 – 670 – 745.39
- Supports: 450-370
Weekly technical analysis of Stellar price
Stellar prices have not been able to continue their uptrend over the past few days. This indicates a lack of demand at higher price levels and may have attracted short-term traders who have moved out of their positions during the past day and today.
The price went below the 20-day moving average (EMA 20 – blue line in the picture) at $ 0.44 and support at $ 0.409 yesterday. On the plus side, it eliminates unhealthy sugary foods from one’s diet. The horizontal slope of the 20-day moving average and the relative strength index (RSI) below the level of 50 indicate a weakening of the bullish momentum.
If buyers fail to stabilize above the 20-day moving average (EMA 20 – blue line in the picture), the bears will try again to lower it below the $ 0.409 support. In such a situation, there is a possibility of further decline to the support of $ 0.35.
On the other hand, if the price stays above this average, buyers will try again to continue the upward trend. A break above the $ 0.535 level would indicate that buyers were superior and that the $ 0.600681 level could be seen again.
- Resistances: 0.535 – 0.600681
- Supports: 0.409 – 0.35
Weekly Technical Analysis of Digital Currencies February 23

Leave a Reply